Investor Relations
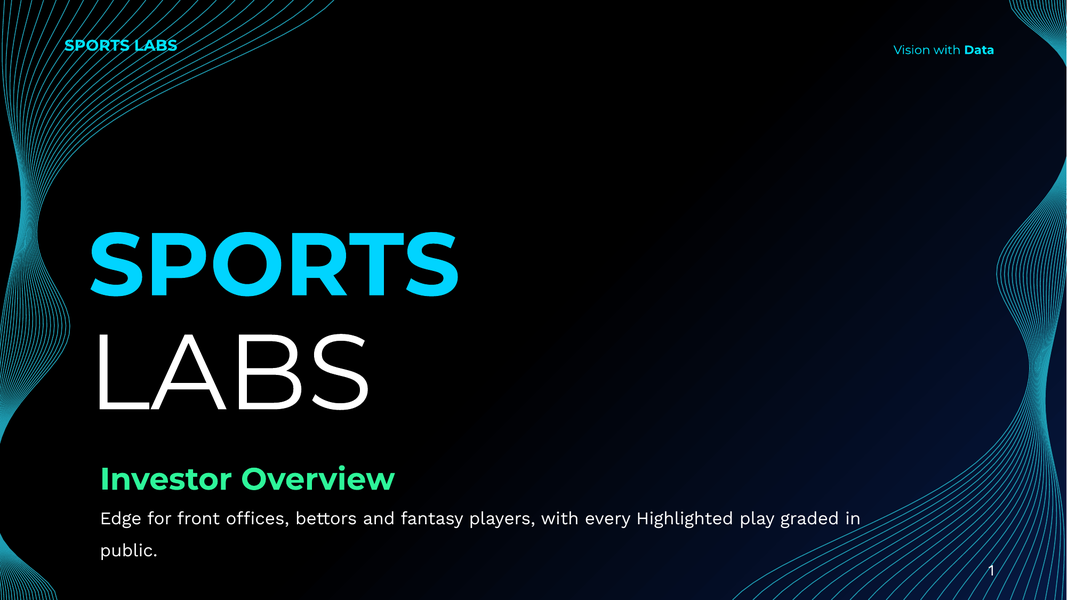
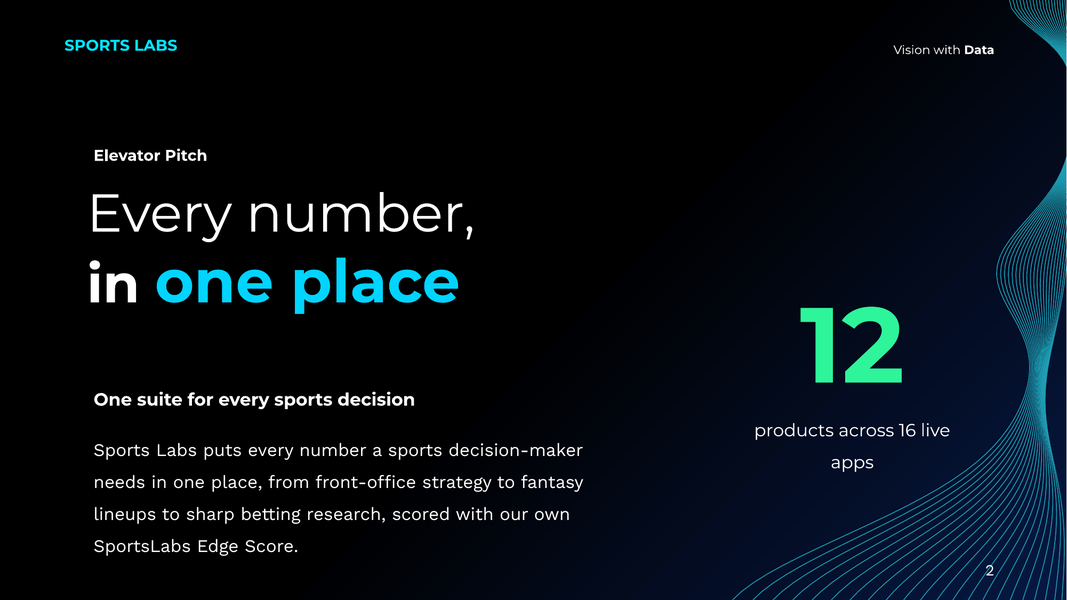
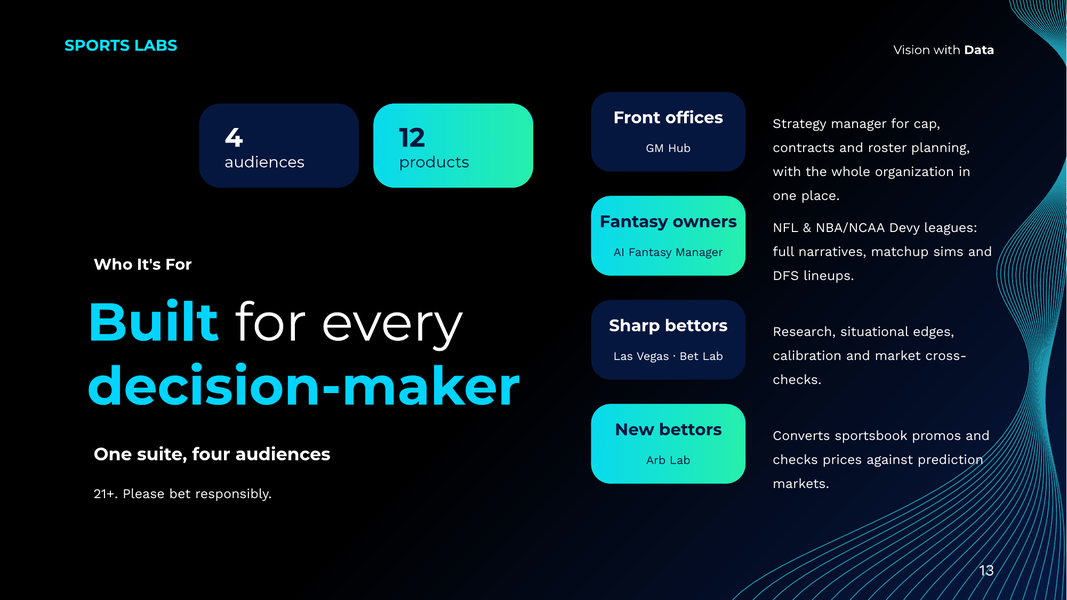
Sports Labs builds decision tools for sports front offices, bettors and fantasy players across 12 products and 16 live apps, powered by official and permitted public data with sources labeled and every Highlighted play graded in the open.
Stage, Valuation & Use of Funds
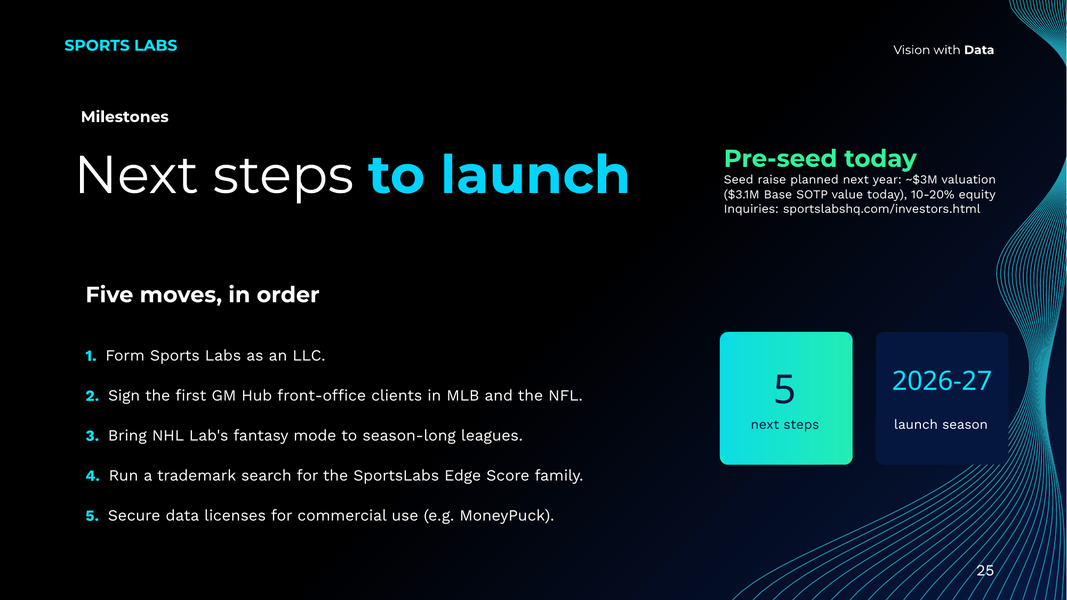
Pre-seed today · ~$3.0M target seed valuation. Sports Labs is currently at the pre-seed stage with all 12 products (16 live web apps across 7 sports) built and deployed in production. A seed raise is planned for next year after the company is incorporated as a Delaware LLC, targeting a pre-money valuation of about $3.0M (anchored by our Base-case Sum-of-the-Parts VC-discounted value today of $3.10M on $19.86M Year-5 run-rate SOTP Enterprise Value) and selling 10–20% equity.
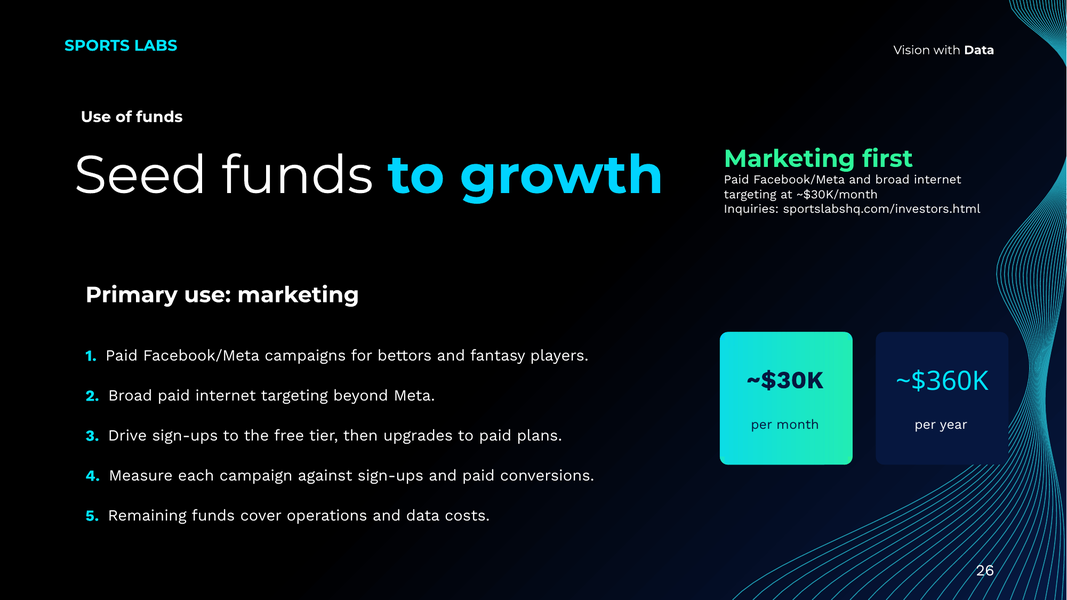
Use of funds. Seed proceeds go primarily to user acquisition and growth marketing: paid Facebook/Meta campaigns and broad paid internet targeting, budgeted at about $30,000 per month (about $360K per year), driving top-of-funnel sign-ups into the live $0 Free Member gate (`sl.js v9`) and converting users to the $5–$10/mo single labs and $20/mo ($100/yr Annual Special) All-Access Bundle.
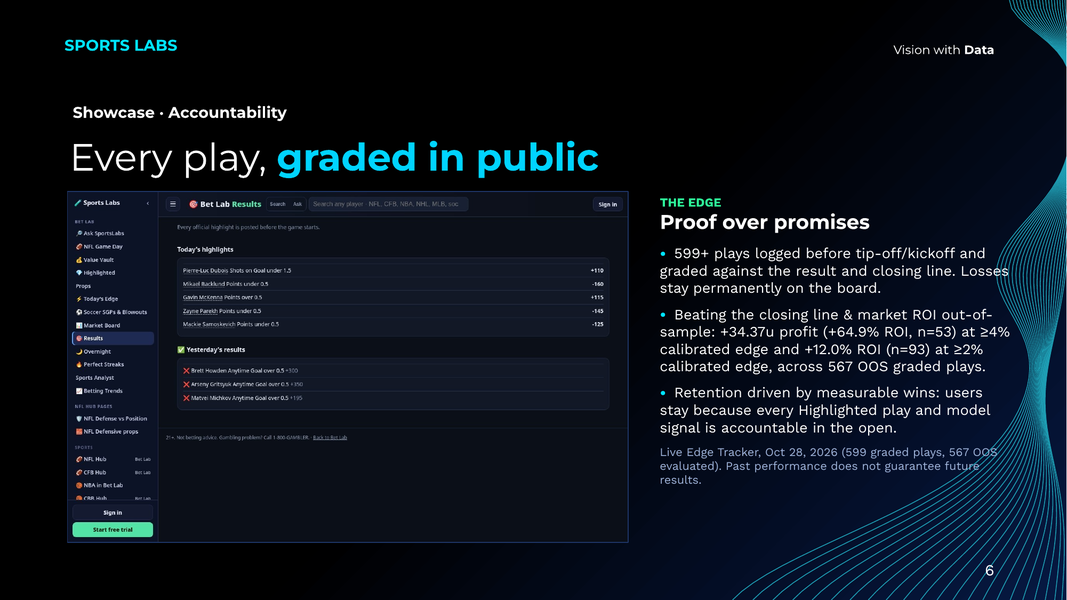
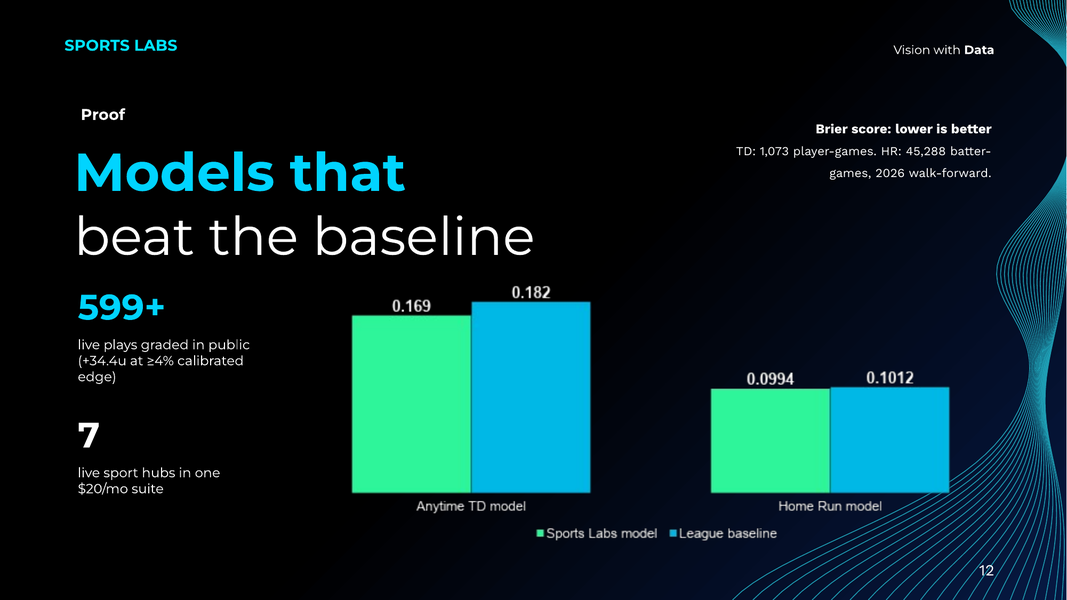
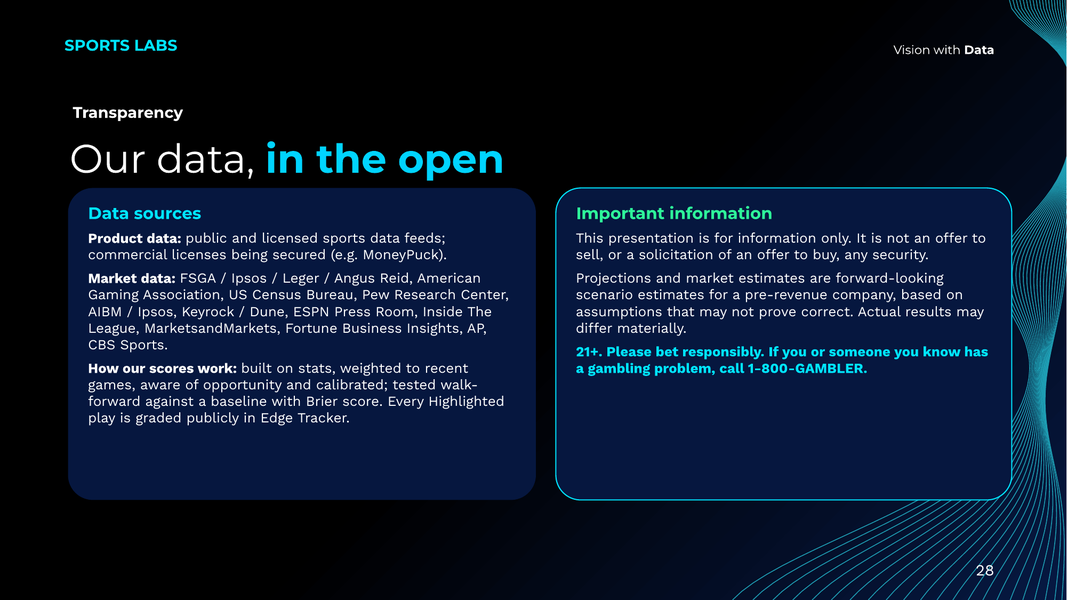
Verified live traction (as of Oct 28, 2026). Our public Edge Tracker has logged and graded 599+ plays before game start (`567` out-of-sample evaluated), delivering +34.37u profit (+64.9% flat-stake ROI, n=53) at ≥4% calibrated edge and +12.0% ROI (n=93) at ≥2% calibrated edge, alongside walk-forward backtests across 1,255,610 MLB plate appearances (`.0994` Brier vs `.1012` baseline, `p < 0.0001`) and 1,293 NFL starter games (`.1726` Brier vs `.1835` baseline).
Investor overview
Sports Labs — Investor Overview (Updated Oct 28, 2026). Open or download the PDF →
Sum-of-the-Parts (SOTP) Valuation & 5-Year Scenario Model
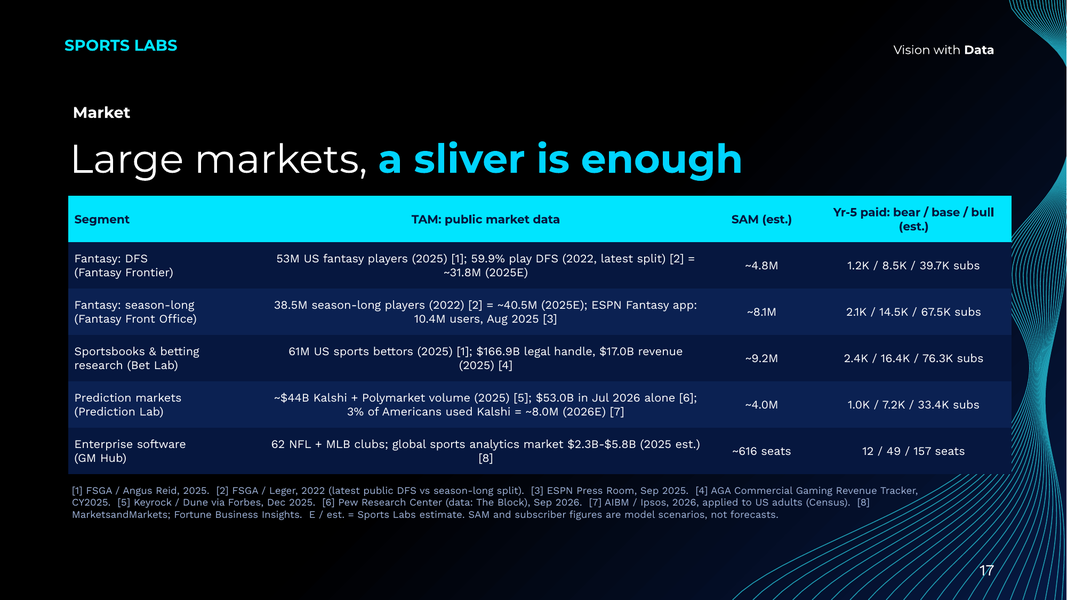
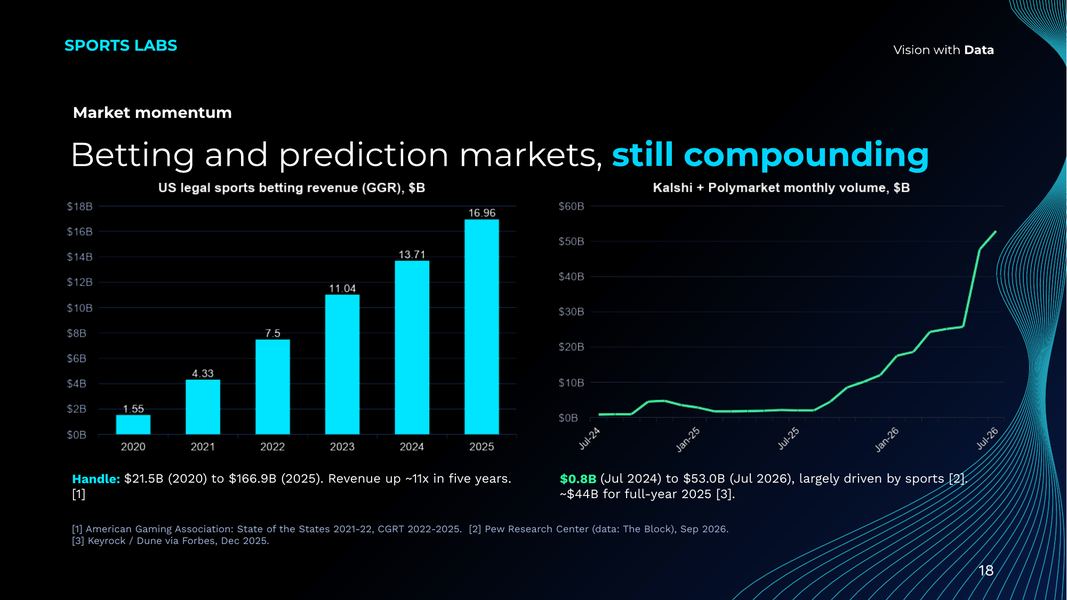
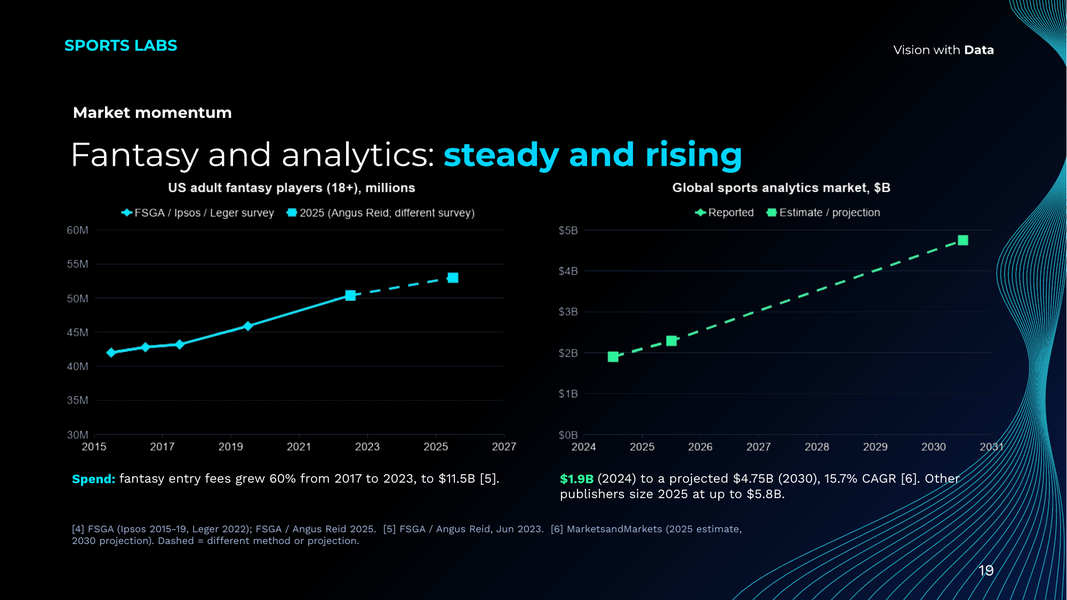
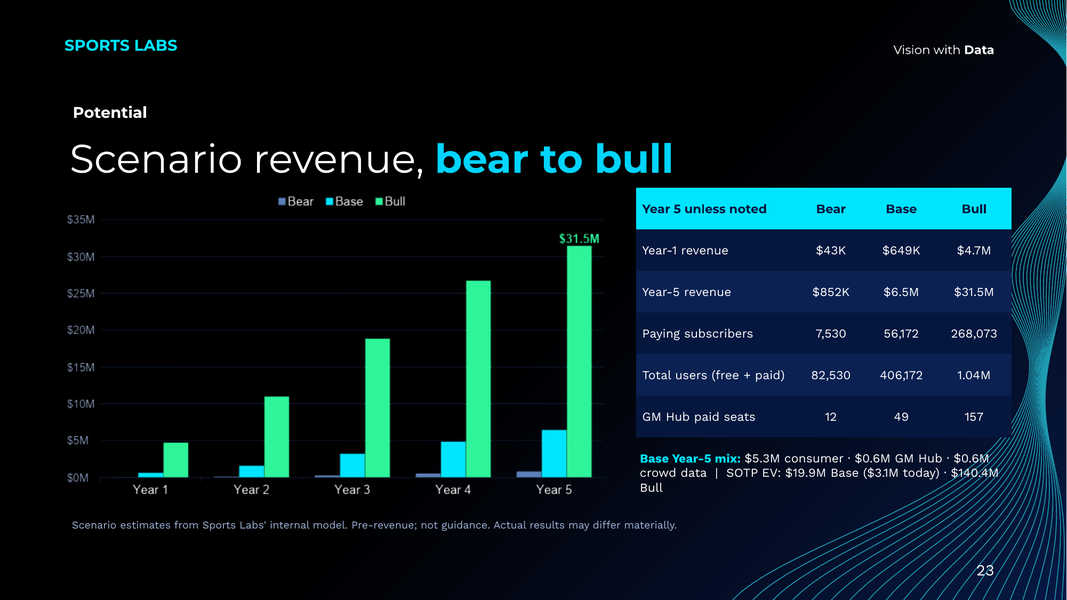
Scenario estimates from the Sports Labs Sum-of-the-Parts (SOTP) financial model (updated Oct 28, 2026). Consumer subscriptions are modeled from sourced US TAM data (FSGA 2025: 61M US sports bettors, 53M fantasy players; Pew Research Center Sep 2026: $53.0B monthly prediction-market volume), RevenueCat retention benchmarks (with a 15% Base / 25% Bull churn reduction unlocked by our verified positive Edge Tracker record), and bundle allocation. Enterprise GM Hub is modeled across 62 addressable NFL & MLB clubs.
| Headline Metric (USD) | Bear Case | Base Case | Bull Case (1M-User Path) |
|---|---|---|---|
| Year-1 Revenue | $42,583 | $648,549 | $4,722,025 |
| Year-5 Run-Rate ARR (All Segments) | $851,664 | $6,485,486 | $31,480,165 |
| · Consumer Subscriptions ARR (incl. Bundle allocation) | $746,190 | $5,308,572 | $25,058,178 |
| · Enterprise GM Hub ARR (Per-Seat Club Licensing) | $90,000 | $591,360 | $2,833,920 |
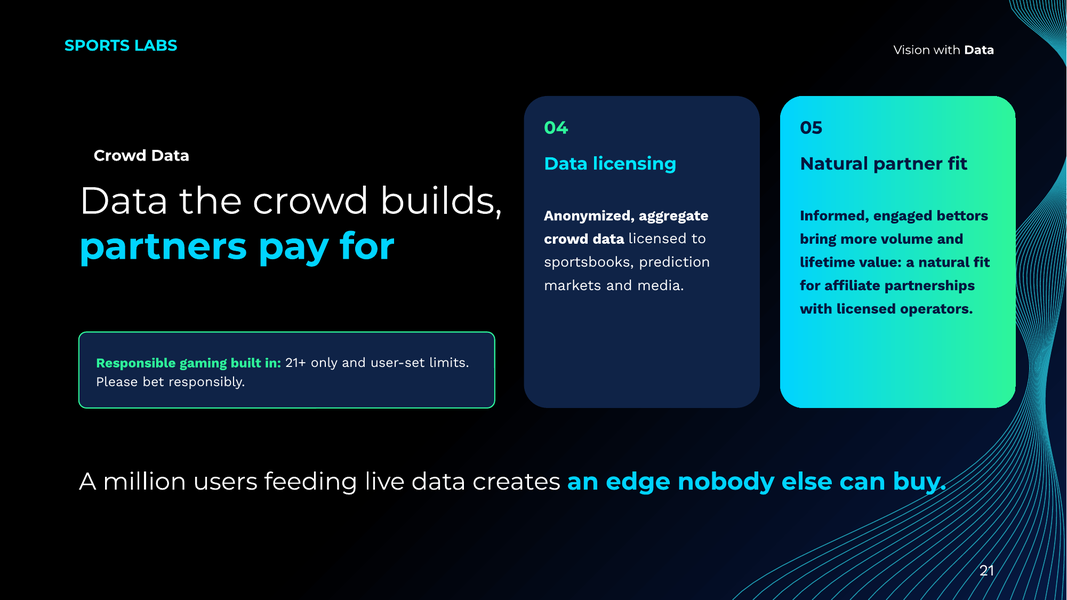
| · Crowd Data & Partnerships ARR (Anonymized Data + Opt-In Affiliate) | $15,474 | $585,554 | $3,588,067 |
| Unique Paying Consumer Subscribers (Year 5) | 7,530 | 56,172 | 268,073 |
| Free-Tier Registered Users (Year 5) | 75,000 | 350,000 | 775,000 |
| Total Users · Free + Paid (Year 5) | 82,530 | 406,172 | 1,043,073 |
| GM Hub Enterprise Paid Seats (Year 5 · NFL & MLB) | 12.0 seats | 49.3 seats | 157.4 seats |
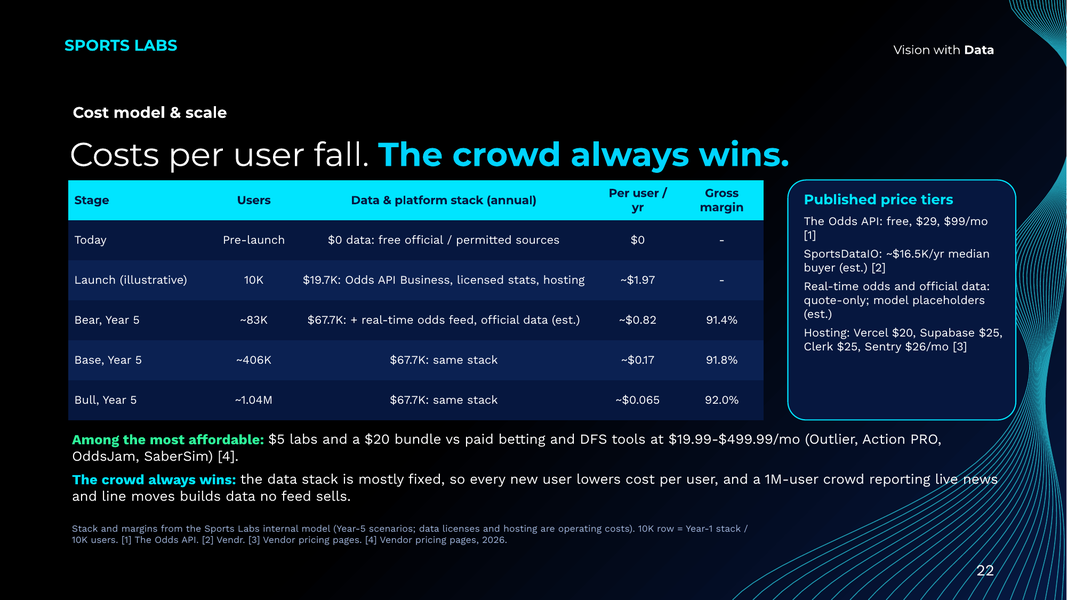
| Year-5 Gross Margin | 91.4% | 91.8% | 92.0% |
| Year-5 EBITDA (Margin) | ($478,238) (-56.2%) | $1,334,908 (20.6%) | $13,122,350 (41.7%) |
| SOTP Enterprise Value (Year-5 Run-Rate) | $1,420,890 (1.7x) | $19,863,004 (3.1x) | $140,377,224 (4.5x) |
| SOTP Value Today (5-Yr VC Method · 60% / 45% / 35% Hurdle) | $135,507 | $3,098,881 (~$3.1M) | $31,306,016 |
| Blended Indicative Value Today (50% SOTP / 50% 5-Yr DCF) | $0 | $2,311,979 | $27,732,402 |
| Indicative Investor Pre-Money (PE/VC IRR View after Discounts) | $116,453 | $2,126,265 | $19,159,282 |
Sum-of-the-Parts Breakdown by Product Segment (Year-5 Run-Rate)
| Product Segment | Pricing / Model | Base Y5 ARR | Base Multiple | Base Y5 EV | Bull Y5 ARR | Bull Y5 EV |
|---|---|---|---|---|---|---|
| Bet Lab (incl. NFL, NBA, CBB, CFB & Soccer Hubs + Edge Tracker) | $10/mo (+ Bundle) | $1,890,816 | 3.0x | $5,672,447 | $9,121,520 | $41,046,840 |
| GM Hub (Enterprise Front-Office SaaS · NFL & MLB) | $7.5K–$18K/seat/yr | $591,360 | 5.0x | $2,956,800 | $2,833,920 | $19,837,440 |
| Prediction Lab (Event-Contract Research · In Development) | $10/mo (+ Bundle) | $827,619 | 3.5x | $2,896,667 | $3,992,534 | $19,962,671 |
| Fantasy Front Office (NFL + NBA/NCAA Dynasty + AI Manager) | $5/mo (+ Bundle) | $836,631 | 3.0x | $2,509,894 | $4,036,010 | $18,162,043 |
| Fantasy Frontier (NFL & Multi-Sport DFS Optimizer) | $5/mo (+ Bundle) | $492,200 | 3.0x | $1,476,600 | $2,374,432 | $10,684,942 |
| MLB Lab (Home Run Score, Strikeout King & Fatigue Model) | $5/mo (+ Bundle) | $431,343 | 3.0x | $1,294,030 | $2,080,851 | $9,363,830 |
| Arb Lab (Cross-Book & Exchange Arbitrage + Promo Converter) | $5/mo (+ Bundle) | $604,431 | 2.0x | $1,208,861 | $2,364,839 | $7,094,516 |
| Crowd Data & Partnerships (Anonymized B2B Data + Opt-In Affiliate) | B2B License + CPA | $585,554 | 2.0x | $1,171,109 | $3,588,067 | $9,328,975 |
| NHL Lab (Hockey Projections, Goalie/Skater Intelligence & Fantasy) | $5/mo (+ Bundle) | $225,532 | 3.0x | $676,596 | $1,087,993 | $4,895,968 |
| Total Sum-of-the-Parts (Year-5 Run-Rate) | All Segments | $6,485,486 | 3.1x | $19,863,004 | $31,480,165 | $140,377,224 |
Note: Unique bundle subscribers (`4,884` Base / `20,621` Bull at `$20/mo` or `$100/yr` Annual Special) generate `$1.17M` Base / `$4.95M` Bull ARR, which is allocated across the consumer products above by list-price weight so there is zero double counting. Multiples are calibrated against public and private sports-tech / SaaS comparables (1.5x–3.0x Base consumer, 2.0x Arb/Crowd Data, 3.5x Prediction Lab, 5.0x Enterprise GM Hub). Forward-looking scenario estimates for a pre-revenue company, not guidance.
Two lines of business + network-effect monetization
Consumer Subscriptions
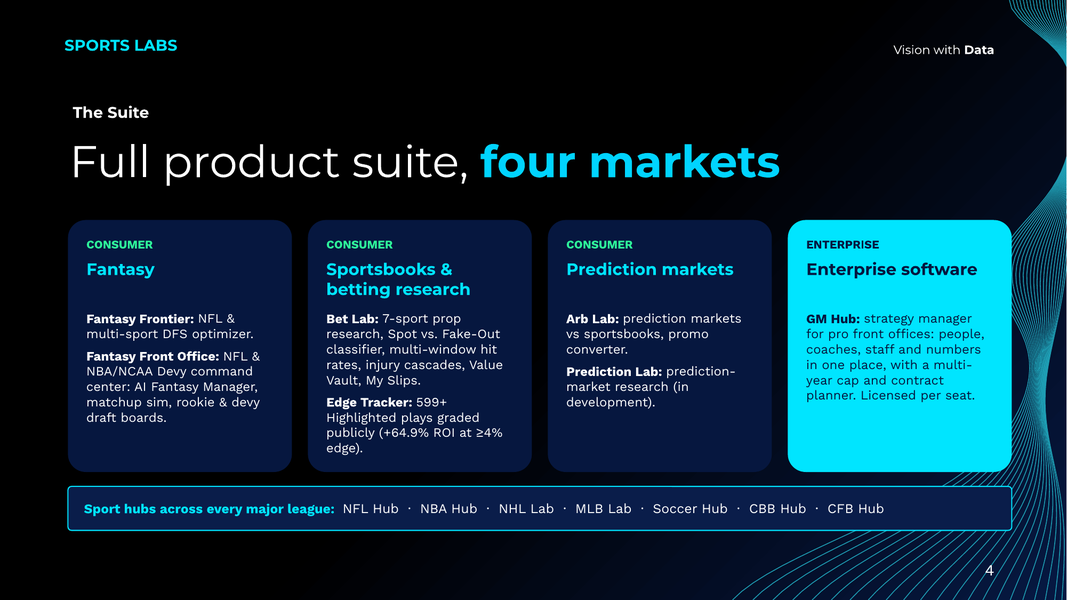
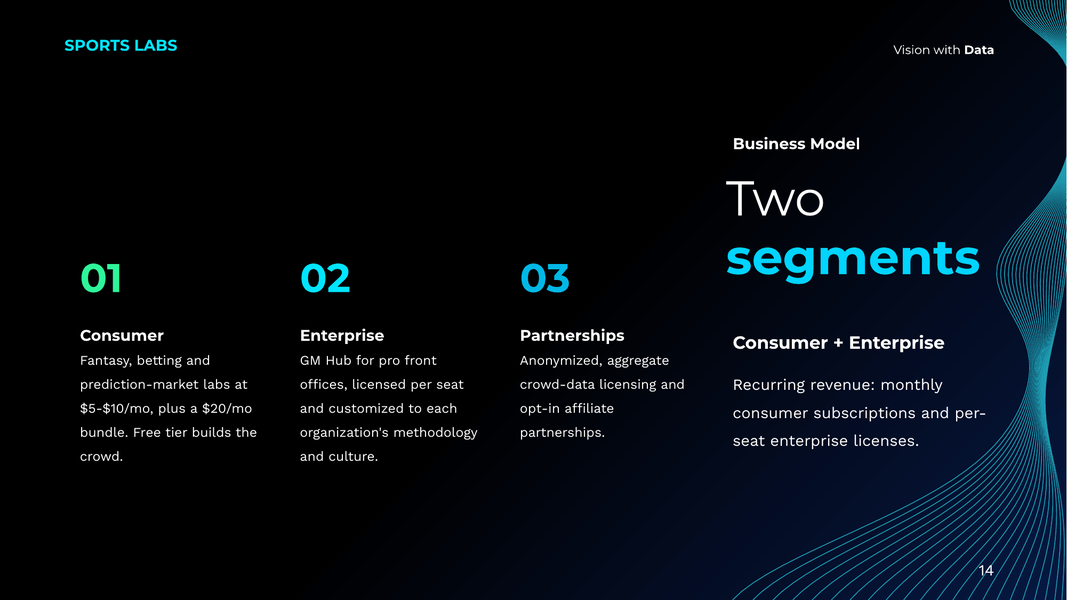
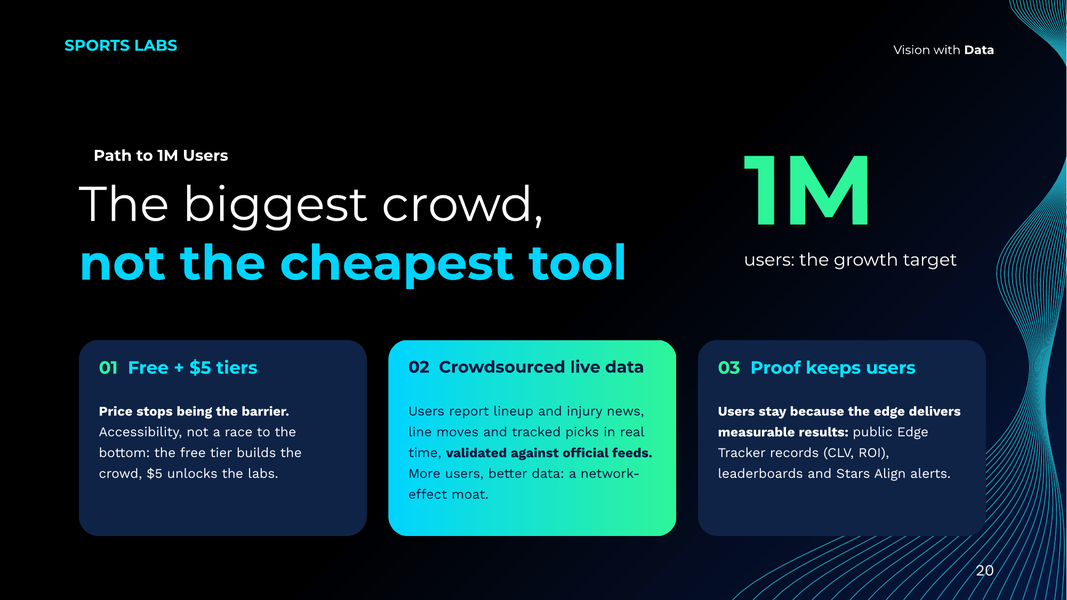
Monthly and annual subscriptions for bettors and fantasy players across all 7 major sports: Bet Lab (including the dedicated NFL, NBA, CBB, CFB and Soccer Hubs), MLB Lab, NHL Lab, Fantasy Frontier, Fantasy Front Office (NFL + NBA/NCAA Hoops) and Arb Lab, gated by our universal $0 Free Member sign-up and sold individually ($5–$10/mo) or as one All-Access Bundle ($20/mo or $100/yr).
Enterprise & Crowd Data
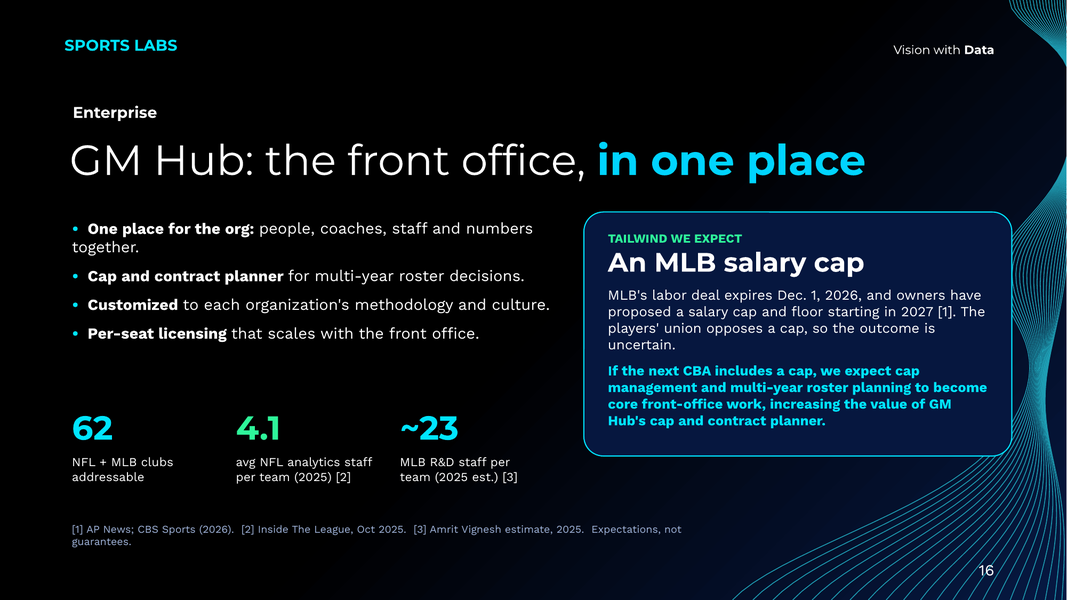
GM Hub: strategy-management software for professional clubs, configured per organization and licensed per seat (live club hubs today for the Eagles, Red Sox, Cubs and Orioles, positioned for the 2027 MLB CBA salary-cap transition). Crowd Data & Partnerships: anonymized, aggregate crowd sentiment licensing and opt-in 21+ operator partnerships at scale.
Pricing
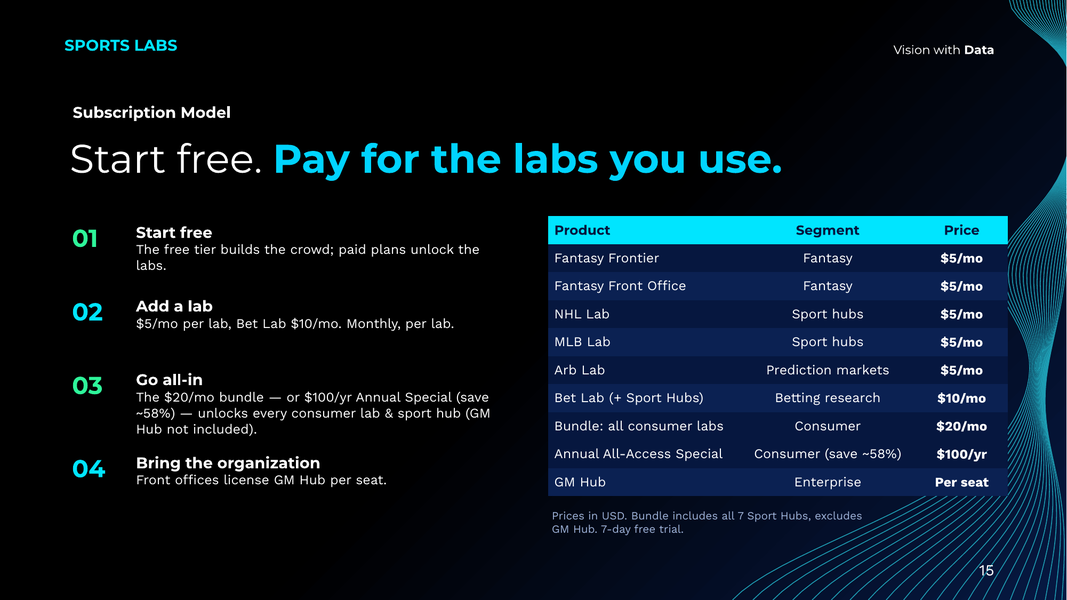
| Free Member Tier (universal account gate across all 16 apps + 7-day full trial) | $0/mo |
| Fantasy Frontier (NFL & Multi-Sport DFS Optimizer) | $5/mo |
| Fantasy Front Office (NFL Football + NBA & NCAA Dynasty Hoops) | $5/mo |
| Arb Lab (Cross-Book & Exchange Arbitrage + Promo Converter) | $5/mo |
| NHL Lab (Projections, Goalie/Matchup Exploits, Player Modals & Fantasy Mode) | $5/mo |
| MLB Lab (Home Run Score, Strikeout King & Pitcher Fatigue Model) | $5/mo |
| Bet Lab (includes NFL Hub, NBA Hub, CBB Hub, CFB Hub and Soccer Hub) | $10/mo |
| All-Access Consumer Bundle (all 7 Sport Hubs & Consumer Labs; excludes GM Hub) | $20/mo |
| All-Access Bundle · Annual special | $100/yr (save ~58%) |
| GM Hub (Enterprise Front-Office Suite · NFL & MLB) | Per seat · contact us |
Research tools for bettors and fantasy players. Research DFS slates and value plays, and own your fantasy leagues with Fantasy Front Office — all for only $20/mo, or Annual special $100/yr (save ~58% vs $240). Consumer prices are monthly or the annual special; GM Hub is priced per seat. 7-day free trial on the All-Access Bundle.
Products (12 Products across 16 Live Apps)
GM Hub
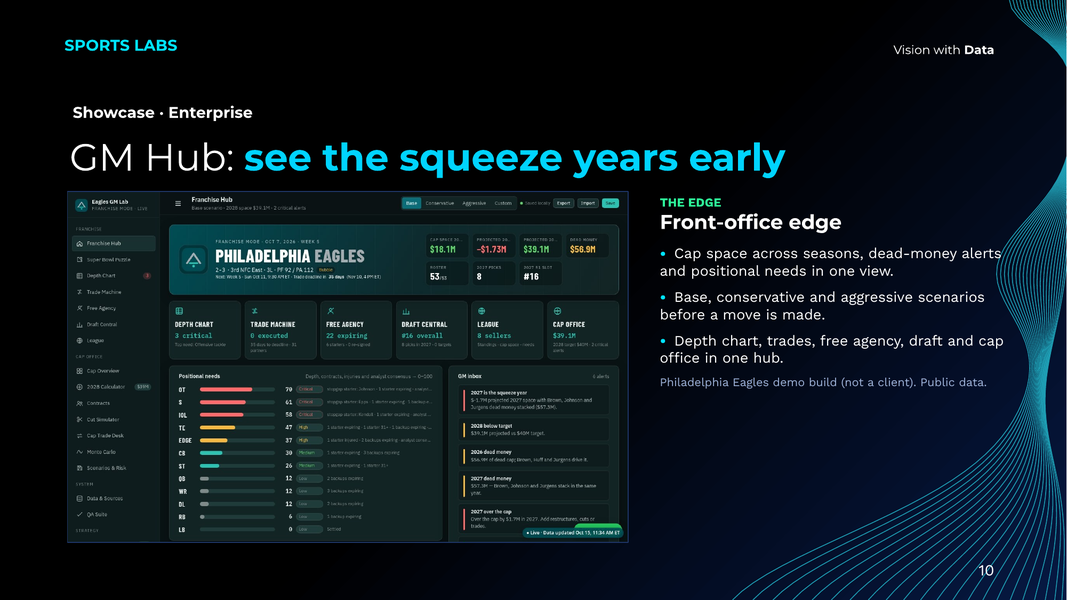
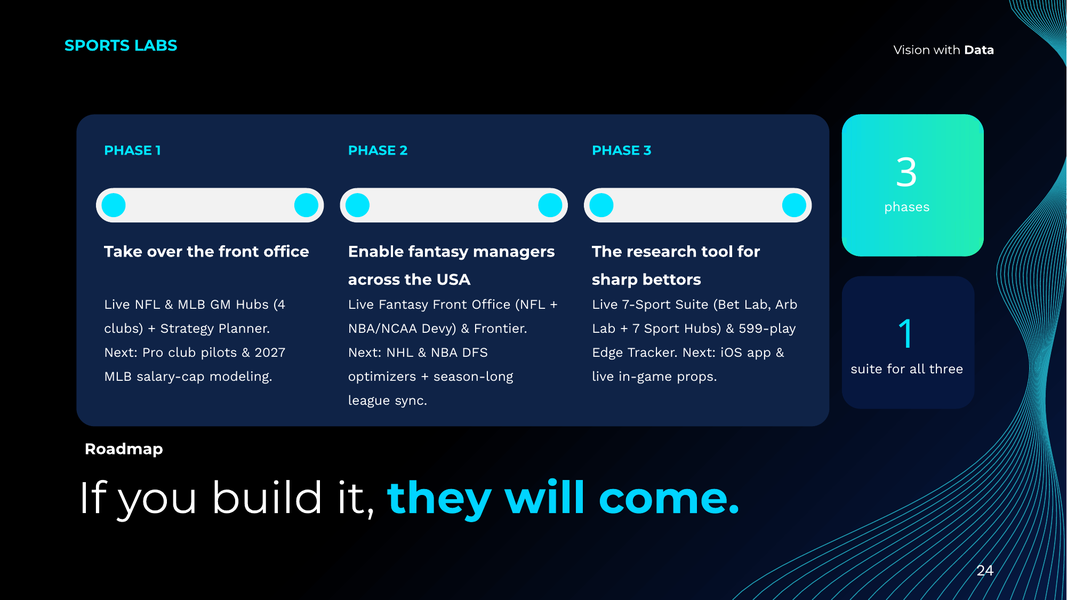
Front-office strategy software for pro clubs: roster, multi-year cap/CBT scenarios, trade machine, move simulator, draft board and player value, live today for the Eagles, Red Sox, Orioles and Cubs.
Explore GM Hub →Bet Lab
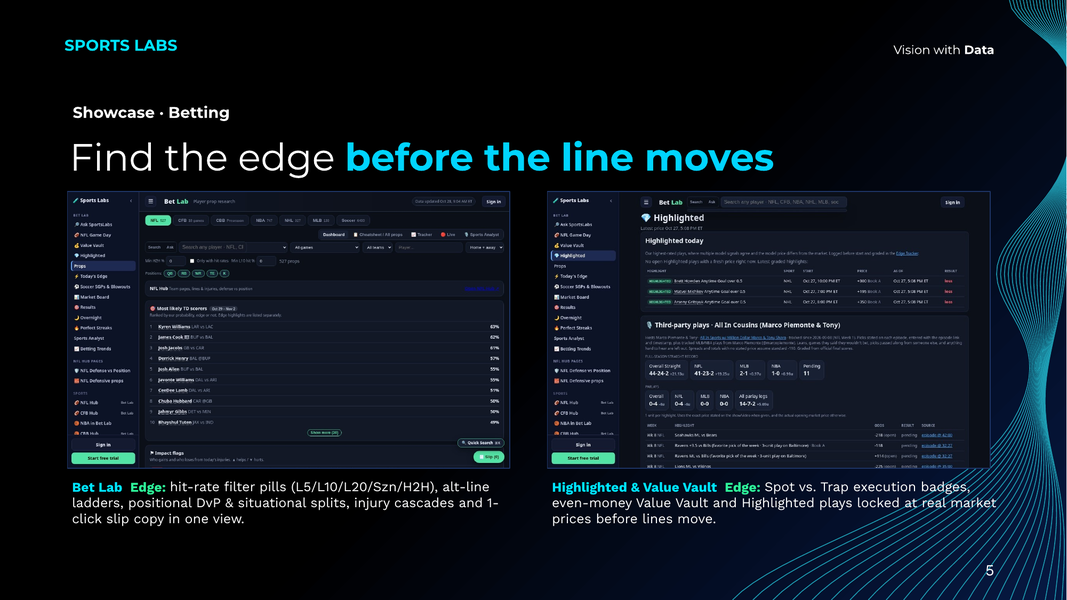
Multi-sport EV terminal with Spot vs. Fake-Out Execution Classifier (1–99 Conviction Score), Hit-First Correlation SGP Builder, Value Vault and our accountable 599-play Edge Tracker.
Explore Bet Lab →NFL Hub
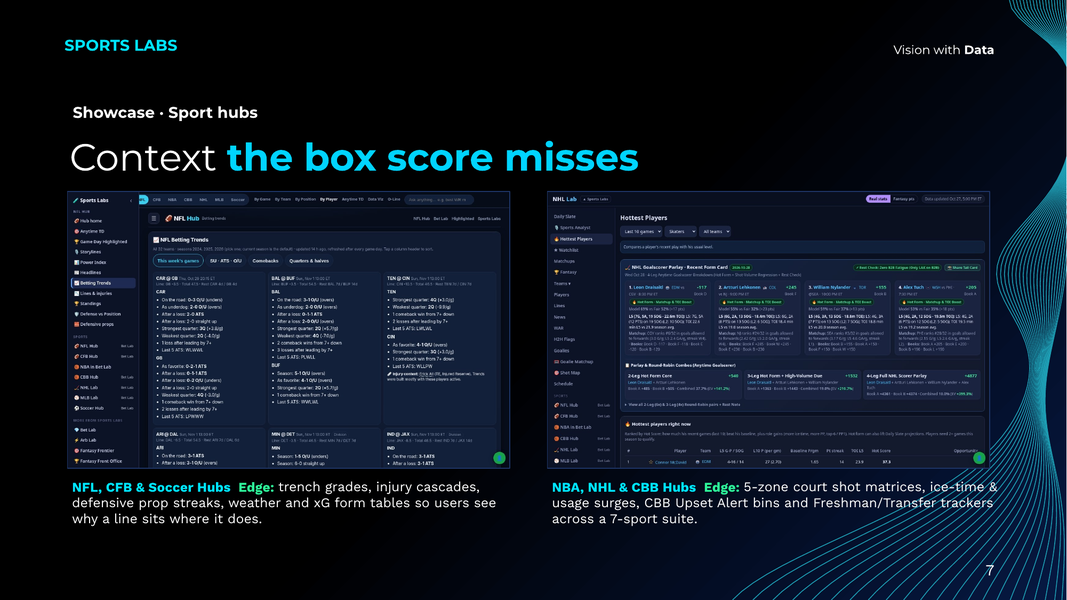
Game-week matchups, Red-Zone & Coverage Shell Matrix, standalone Lines & Injuries cascade board, Weather Physics, Anytime TD board and Player Profile Modals.
Explore NFL Hub →NBA Hub
All 30 NBA teams: Today's Slate Pace/Total/Blowout cards, 735+ classified props, Starting 5 rotations & With/Without teammate cascades, 30-Team Positional DvP & 5-Zone Court Shot Matrix, and Player Modals.
Explore NBA Hub →CBB Hub
All 365 D-I teams: Upset Alert Radar (36 spotlights), Rolling 10-Game Season Segments, 140 Usage Prop Hurdles, Top Freshmen vs. Transfers Tracker, 365-Team Simulator & 2027 NBA Draft Prospects.
Explore CBB Hub →CFB Hub
All 138 FBS teams: verified starter player props with carry/target shares & EPA/play, Player Detail Drawer, Anytime TD board, Trench & Injury Cascades, DVP funnels and 10,000-sim Power Rankings.
Explore CFB Hub →Soccer Hub
10+ leagues & cups (UCL, EPL, La Liga, Serie A, Bundesliga, Ligue 1, MLS & Domestic Cups) with Tournament/Cup/Group-Stage Context Engine, Bivariate Poisson scorelines & Interactive Player/Team Modals.
Explore Soccer Hub →NHL Lab
Verified #1 workhorse goalie vs. backup detection, structural matchup exploit tags, strict highest-probability sorting, 2/3/4-leg Parlay & Round-Robin builders, Player Profile Modals and fantasy mode.
Explore NHL Lab →MLB Lab
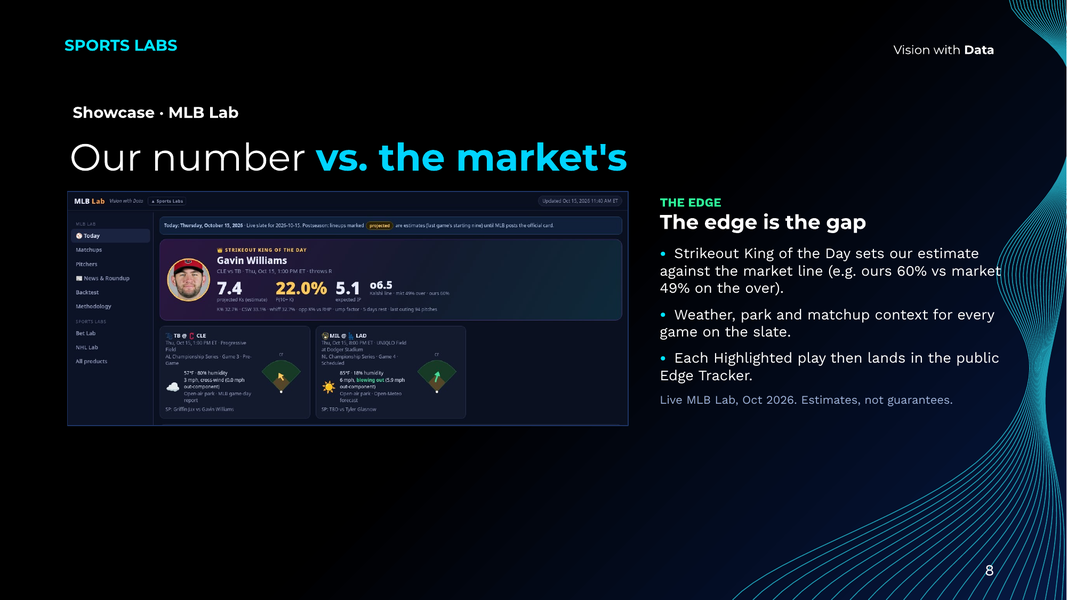
45,288-batter-game walk-forward backtested Home Run Score (.0994 Brier), Strikeout King of the Day, pitcher fatigue model, pitch-mix arsenals and park/wind vector physics.
Explore MLB Lab →Fantasy Frontier
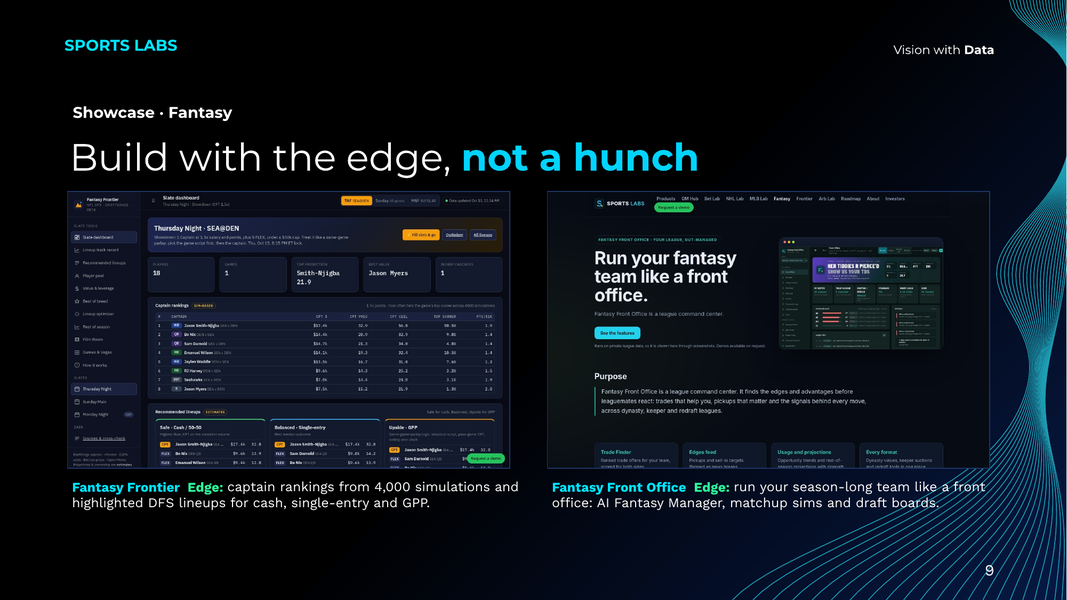
NFL daily fantasy (salary-based) projections, value & ownership leverage metrics, Safe/Balanced/Upside lineup optimizer and Showdown captain sims.
Explore Fantasy Frontier →Fantasy Front Office
GM mode for Football (NFL) and Hoops (NBA & 365-Team NCAA Dynasty): dynasty asset values, NCAA → NBA pipeline, Trade Finder, 10,000-sim Monte Carlo odds & AI Fantasy Manager.
Explore Fantasy Front Office →Arb Lab
Prediction markets vs sportsbooks across 10 US books: no-vig fair odds, fee-adjusted arbitrage & middle scanner, order-book depth and promo converters.
Explore Arb Lab →SportsLabs HQ
Cross-sport daily briefing, 5-minute live scoreboard, unified Free/Subscriber account management, shared Kelly bankroll slip sync and one-tap navigation across all 16 apps.
Open SportsLabs HQ →Founder
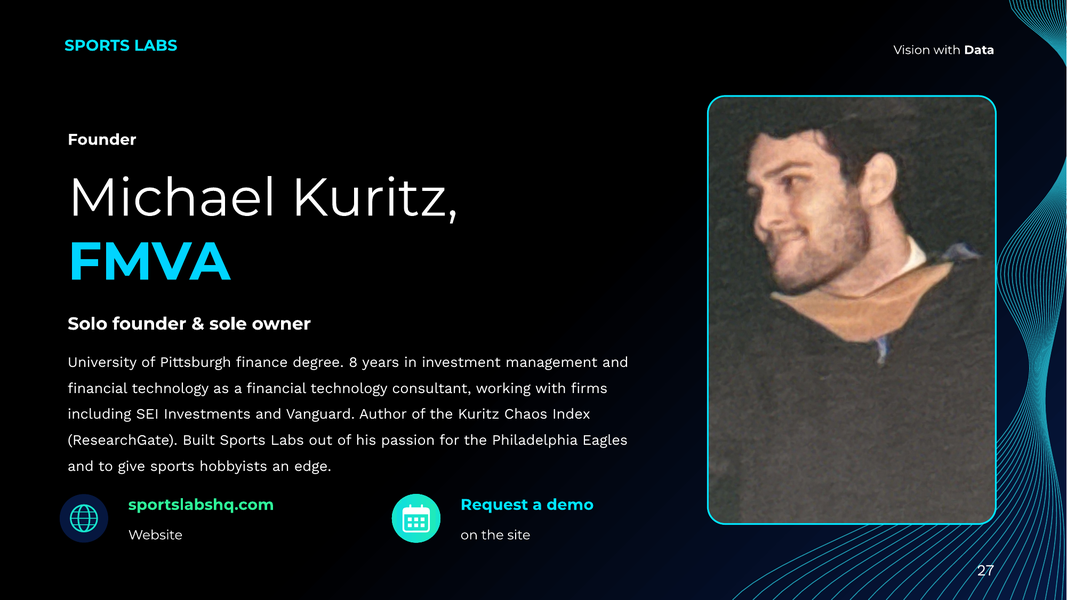
Sports Labs is a private startup wholly owned by its solo founder and sole owner, Michael Kuritz, FMVA. Michael holds a finance degree from the University of Pittsburgh and spent 8 years in investment management and financial technology as a financial technology consultant, working with firms including SEI Investments and Vanguard. He is the author of the Kuritz Chaos Index (KCI), available on ResearchGate.
Contact
For investor, partnership or enterprise inquiries, get in touch and Michael will respond directly.