Research the number before you play. Own your fantasy leagues.
One place for multi-book prop pricing, edges, DFS lineups and league tools across 12 products (16 live apps): Bet Lab (NFL, CFB, NBA, CBB, NHL, MLB and soccer), dedicated NFL, CFB, NBA, CBB, NHL, MLB and Soccer Hubs, Arb Lab, Fantasy Frontier, Fantasy Front Office, SportsLabs HQ and GM Hub.
The suites
Twelve products across sixteen live apps, sharing one data, live multi-book pricing and walk-forward modeling backbone.
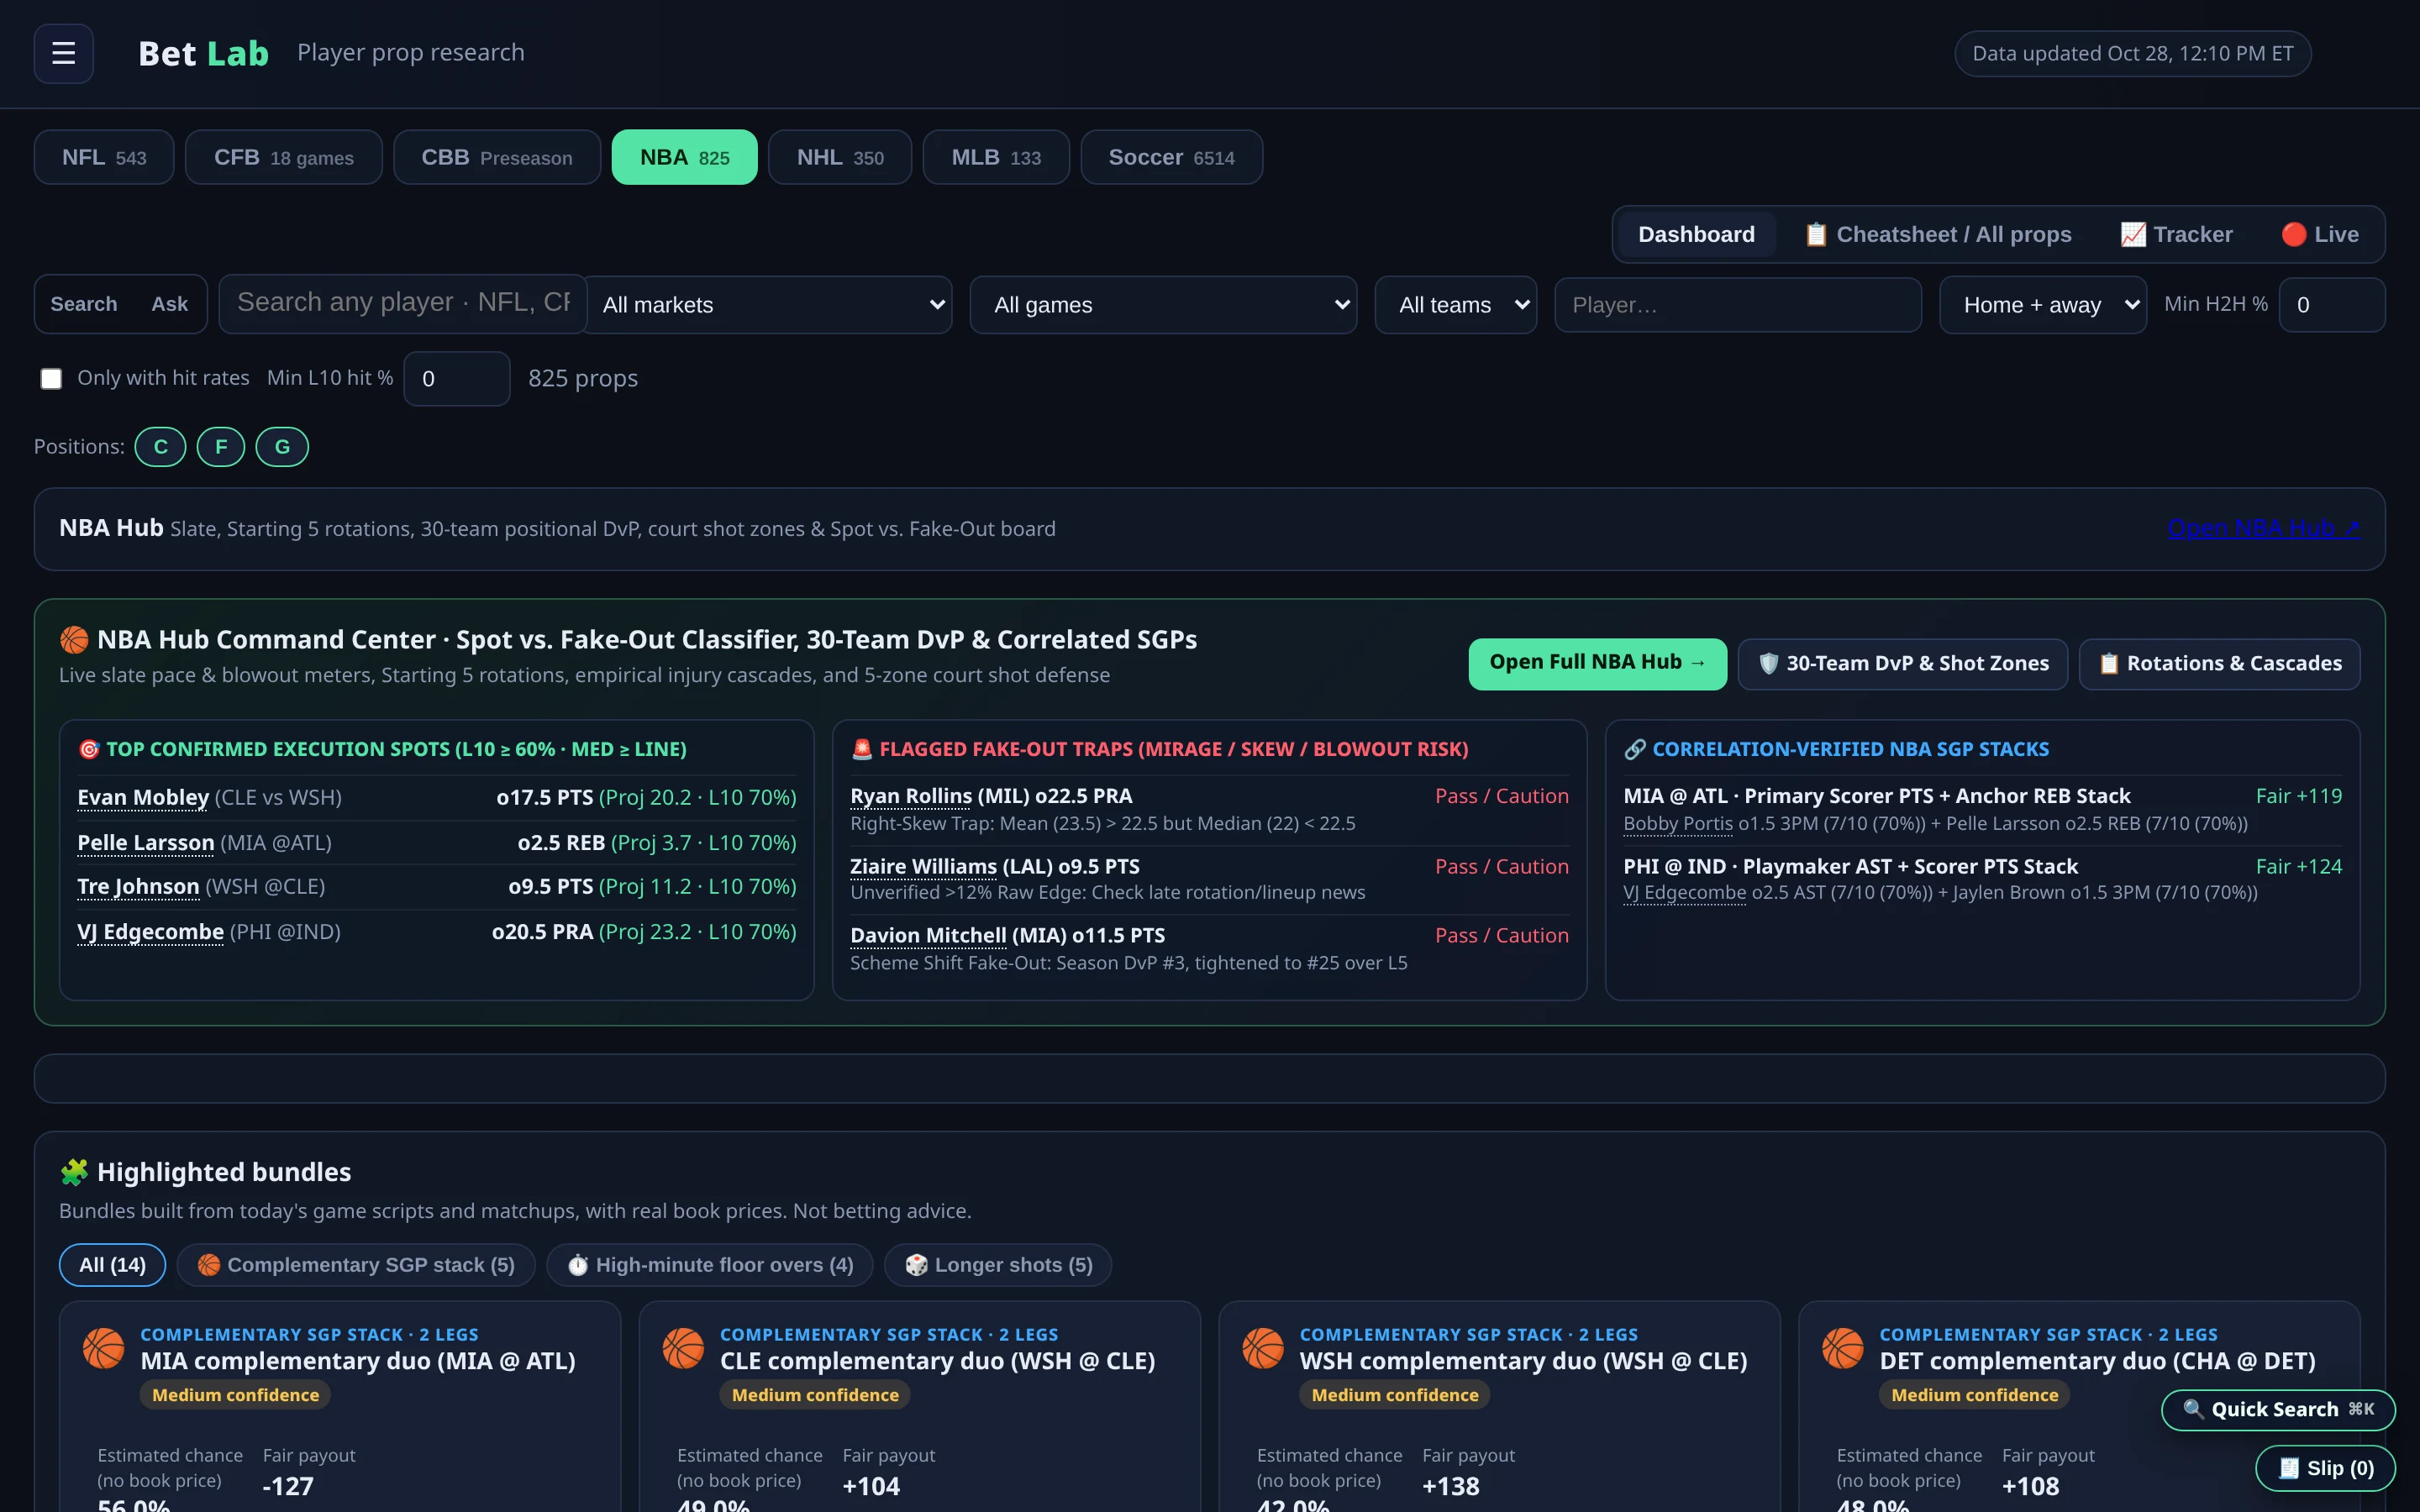
Bet Lab
Multi-sport player props and game lines across NFL, CFB, NBA, CBB, NHL, MLB and 10+ soccer leagues with our Spot vs. Fake-Out Execution Classifier (1–99 Conviction Score + 5-Point Checklist), Hit-First Correlation SGP Builder, Value Vault, 5-minute live tracker and accountable 599+ play Edge Tracker (+64.9% ROI at ≥4% calibrated edge).
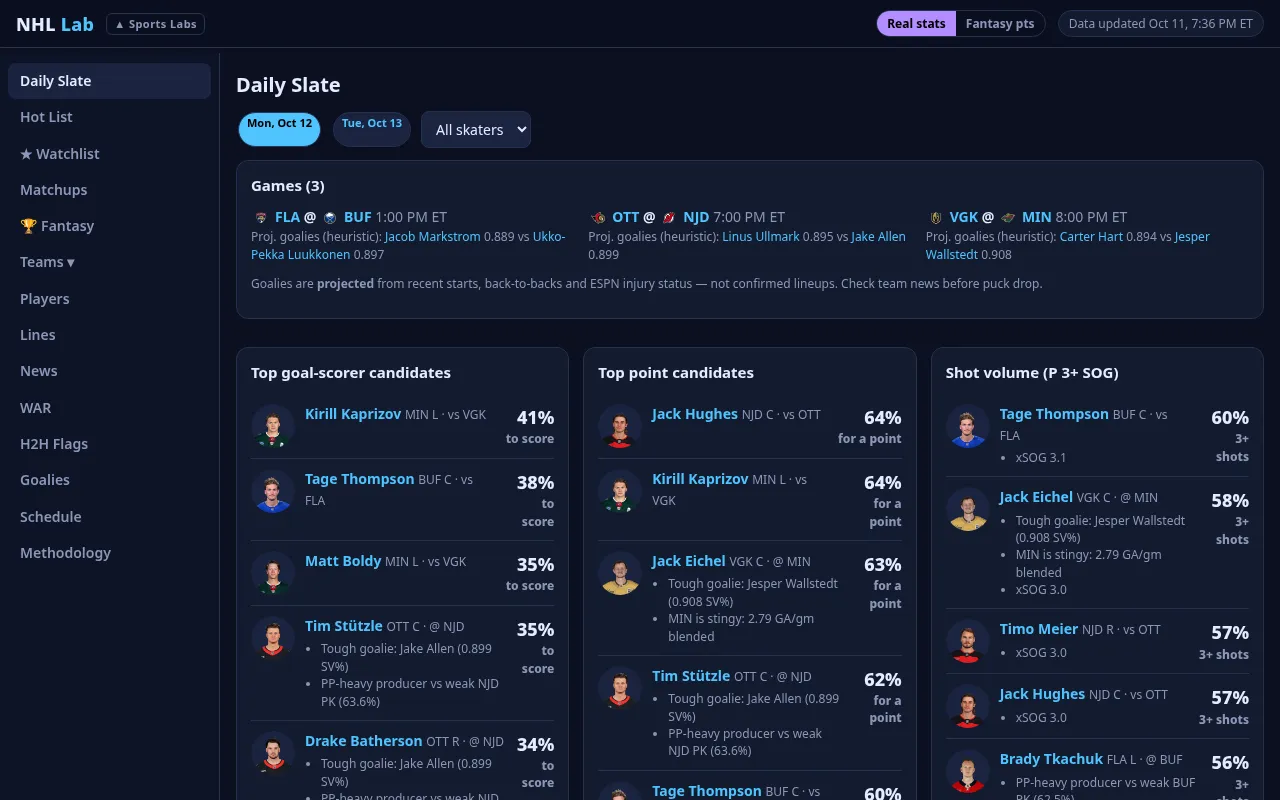
Explore Bet Lab →NHL Lab + Fantasy
Verified #1 workhorse starter vs. backup goalie detection, structural matchup exploit tags (PP1 vs #23+ PK, Weak Crease, High-Slot Vol, Fresh vs B2B), strict highest-probability sorting, 2/3/4-leg Parlay & Round-Robin builders, clickable Player Profile Modals and fantasy mode.
Explore NHL Lab →Fantasy Front Office NFL + Hoops
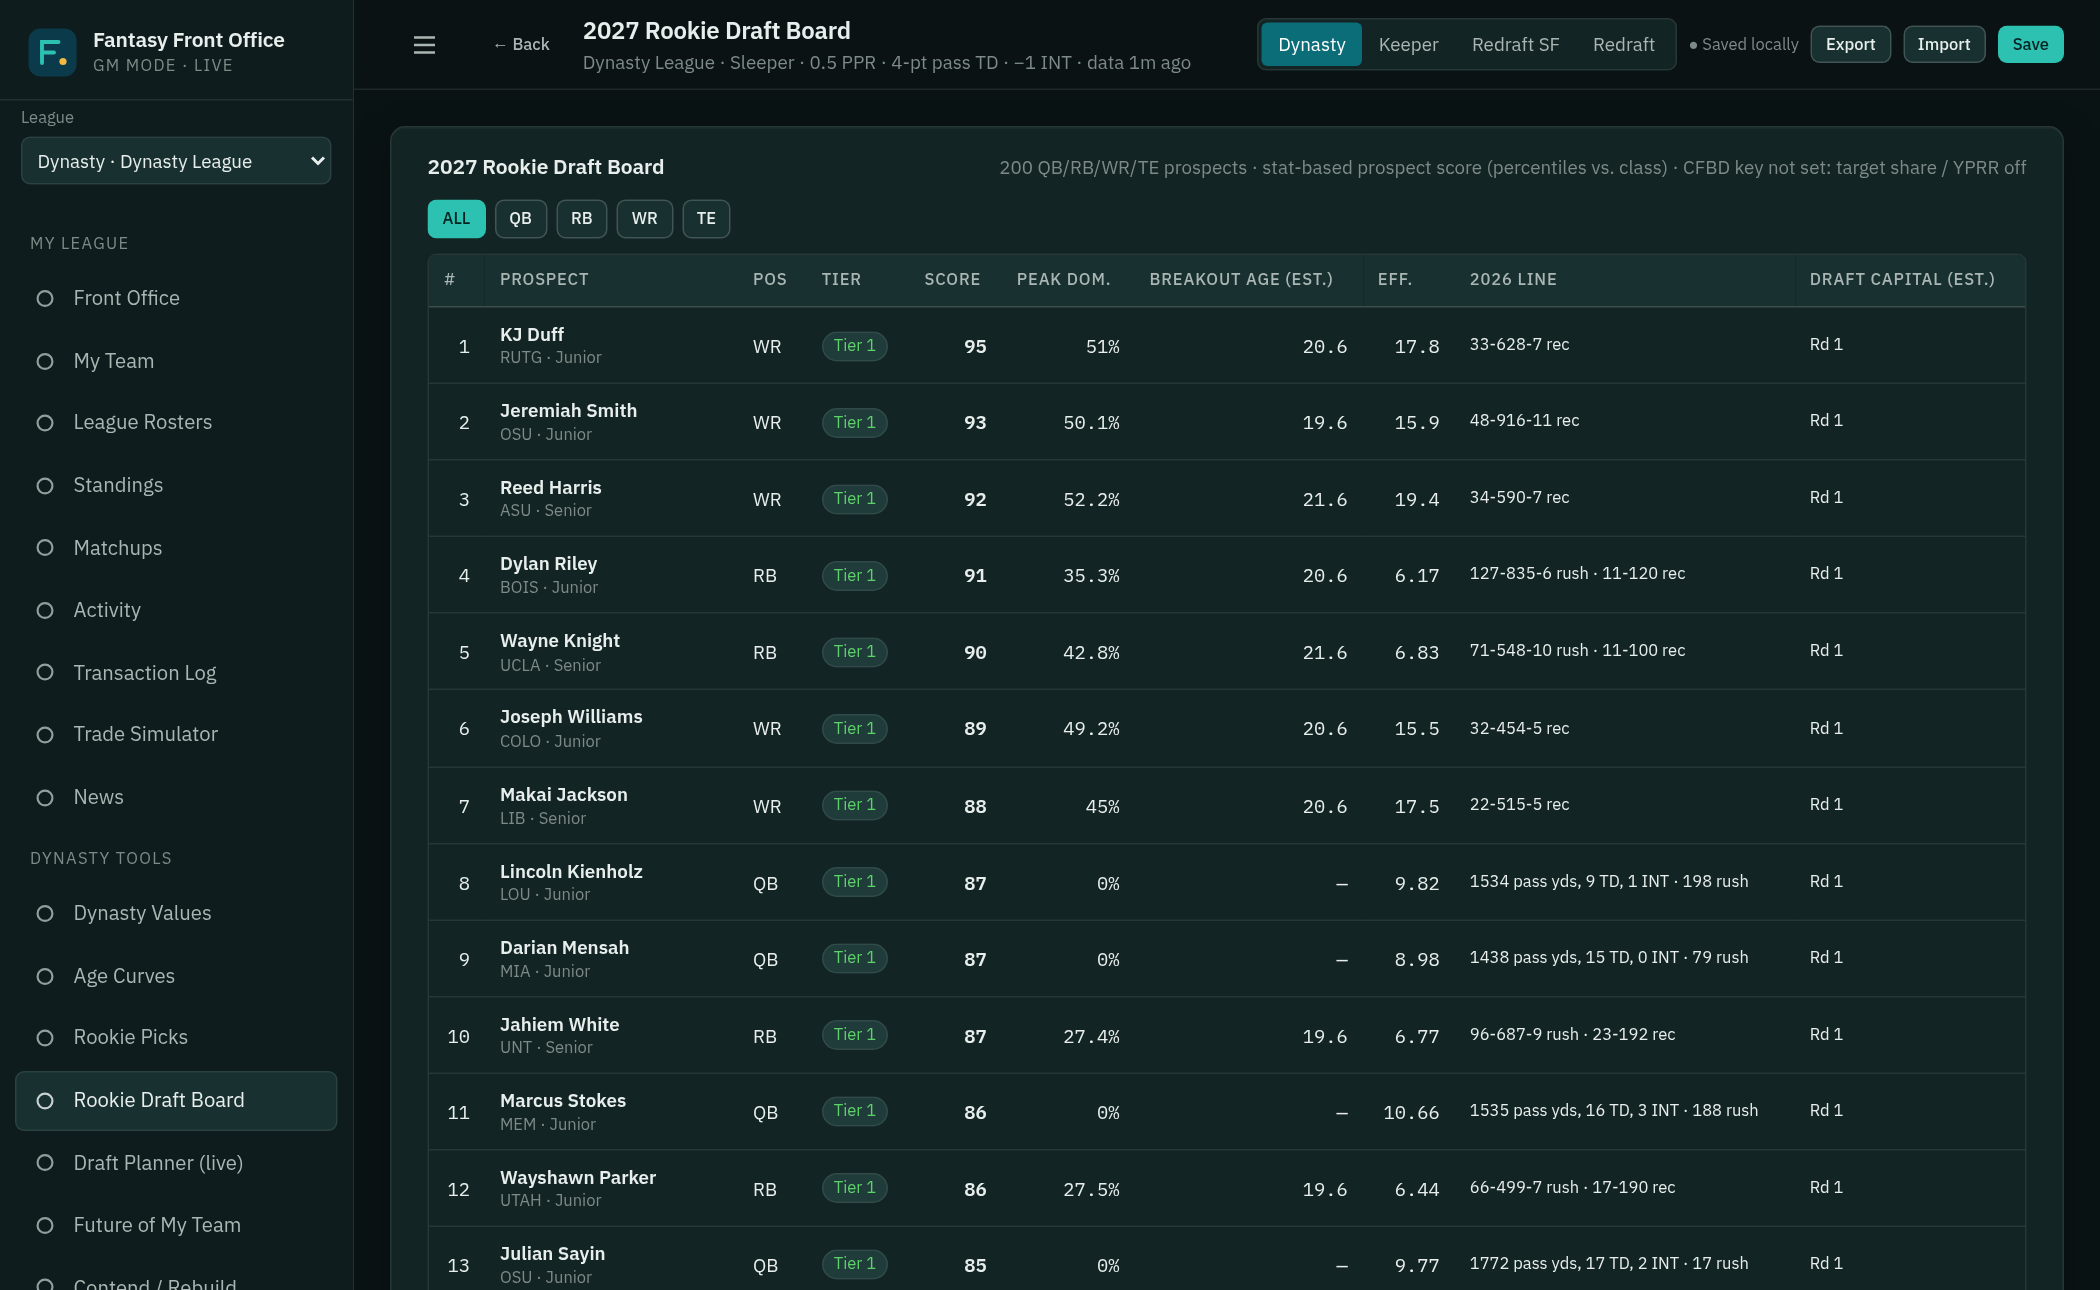
GM mode for fantasy managers across Football (NFL) and Hoops (NBA & NCAA Dynasty): dynasty, keeper-auction and redraft leagues with league-scored values, trade analyzer, NCAA → NBA pipeline, Monte Carlo playoff odds and AI Fantasy Manager.
Explore Fantasy Front Office →Fantasy Frontier
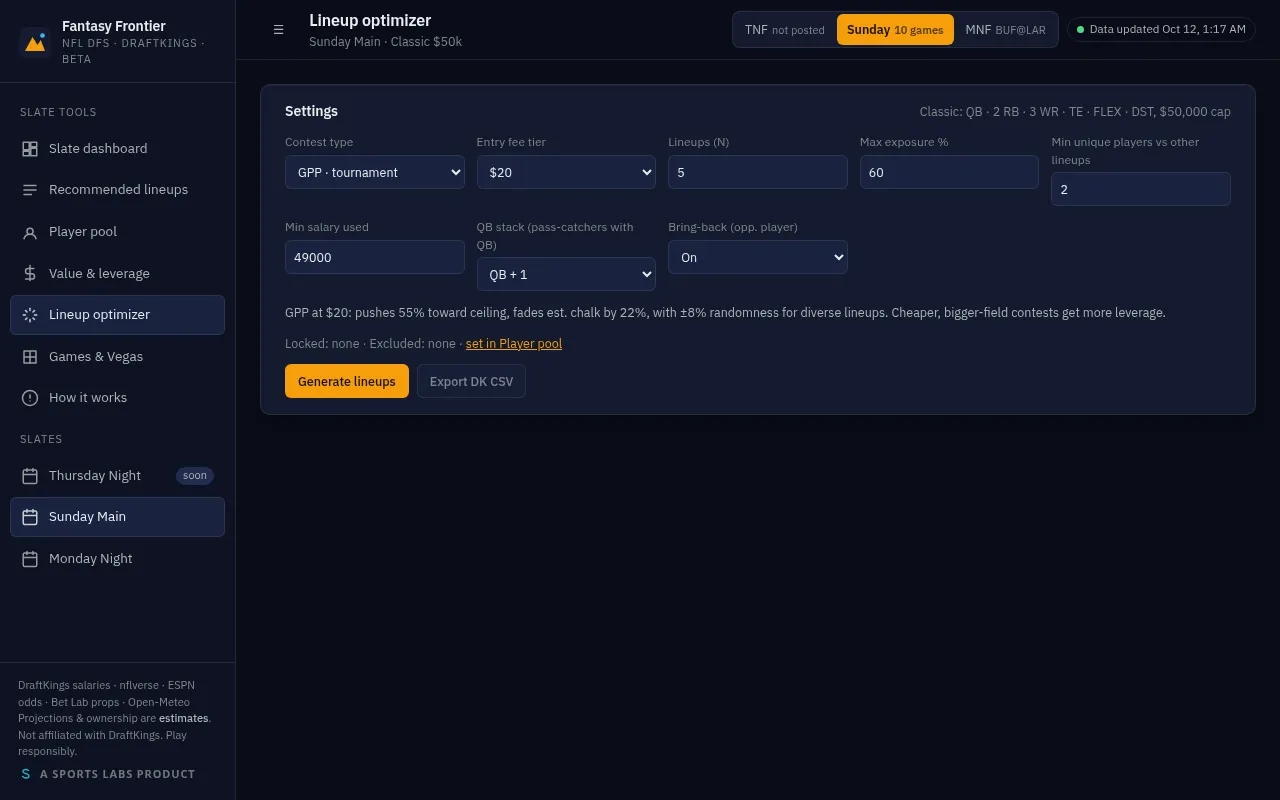
NFL daily fantasy (salary-based) for Thursday, Sunday and Monday slates: stat-based projections, value plays, ownership leverage, highlighted lineups and a lineup optimizer with stacks and CSV export.
Explore Fantasy Frontier →Arb Lab
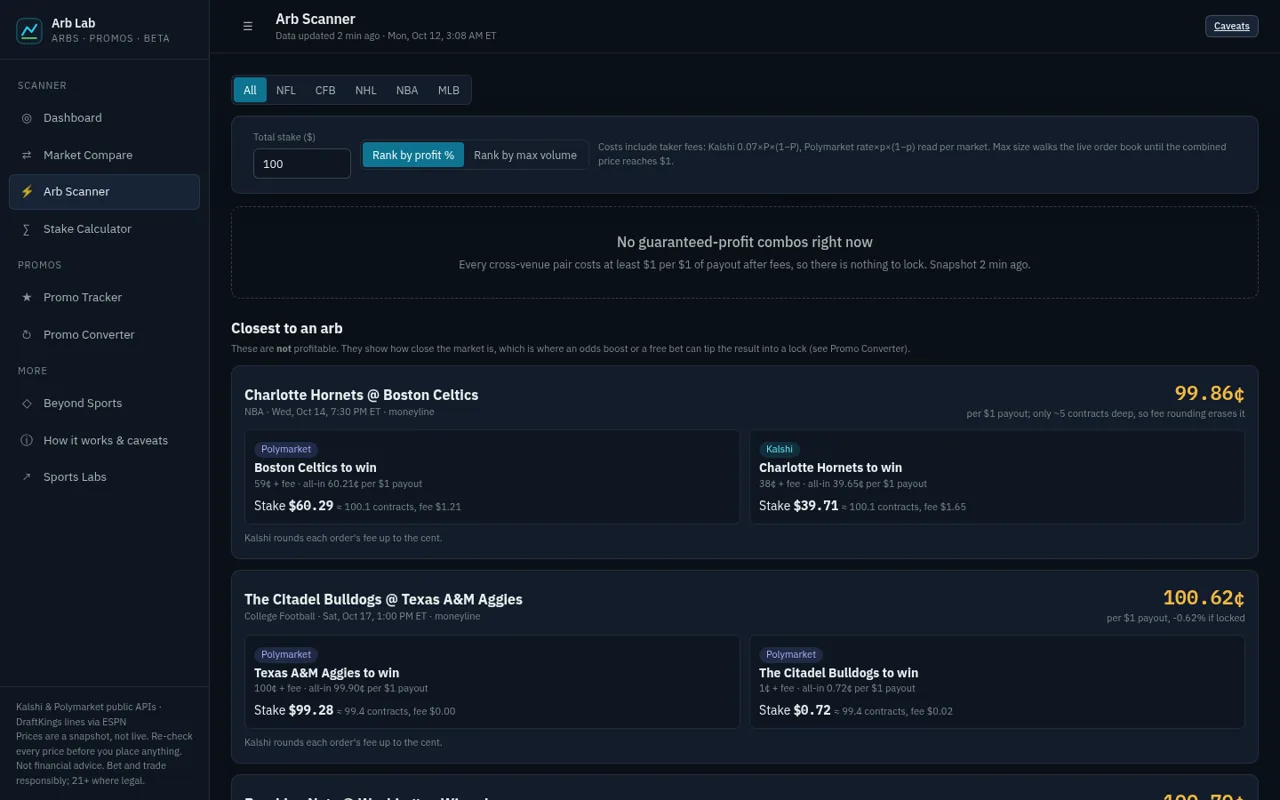
exchange and book prices side by side, with no-vig fair odds, a fee-adjusted arbitrage scanner with order-book depth, and calculators that estimate the value of free bets and boosts, before fees and execution risk.
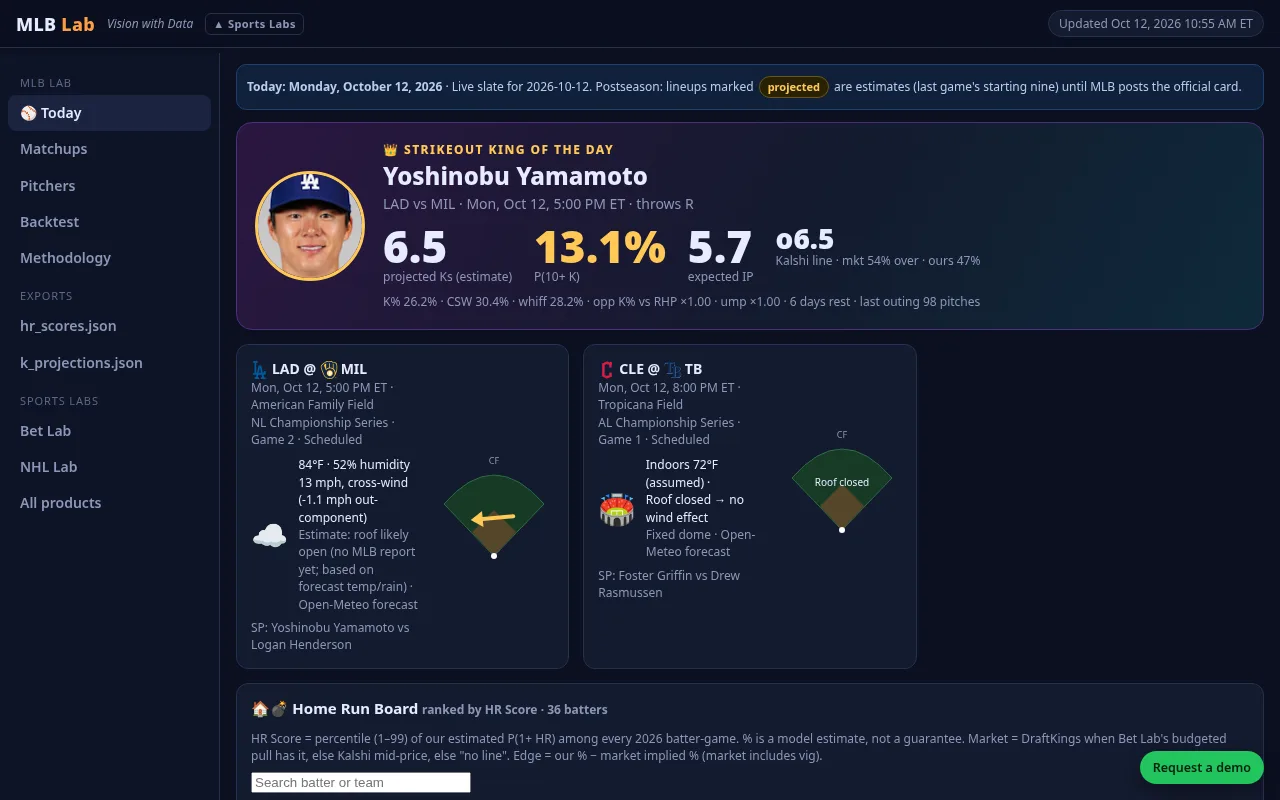
Explore Arb Lab →MLB Lab
Vision with Data. A proprietary Home Run Score and a % estimate for every batter, the Strikeout King of the Day with a fatigue and workload model, batter-vs-pitcher matchups, park and wind visuals and compared with market prices.
Explore MLB Lab →NFL Hub
Dedicated NFL game-week command center: Matchups & defensive funnels, a standalone Lines & Injuries cascade board, Highlighted plays, Anytime TD model with live multi-book prices and correlated SGP builder.
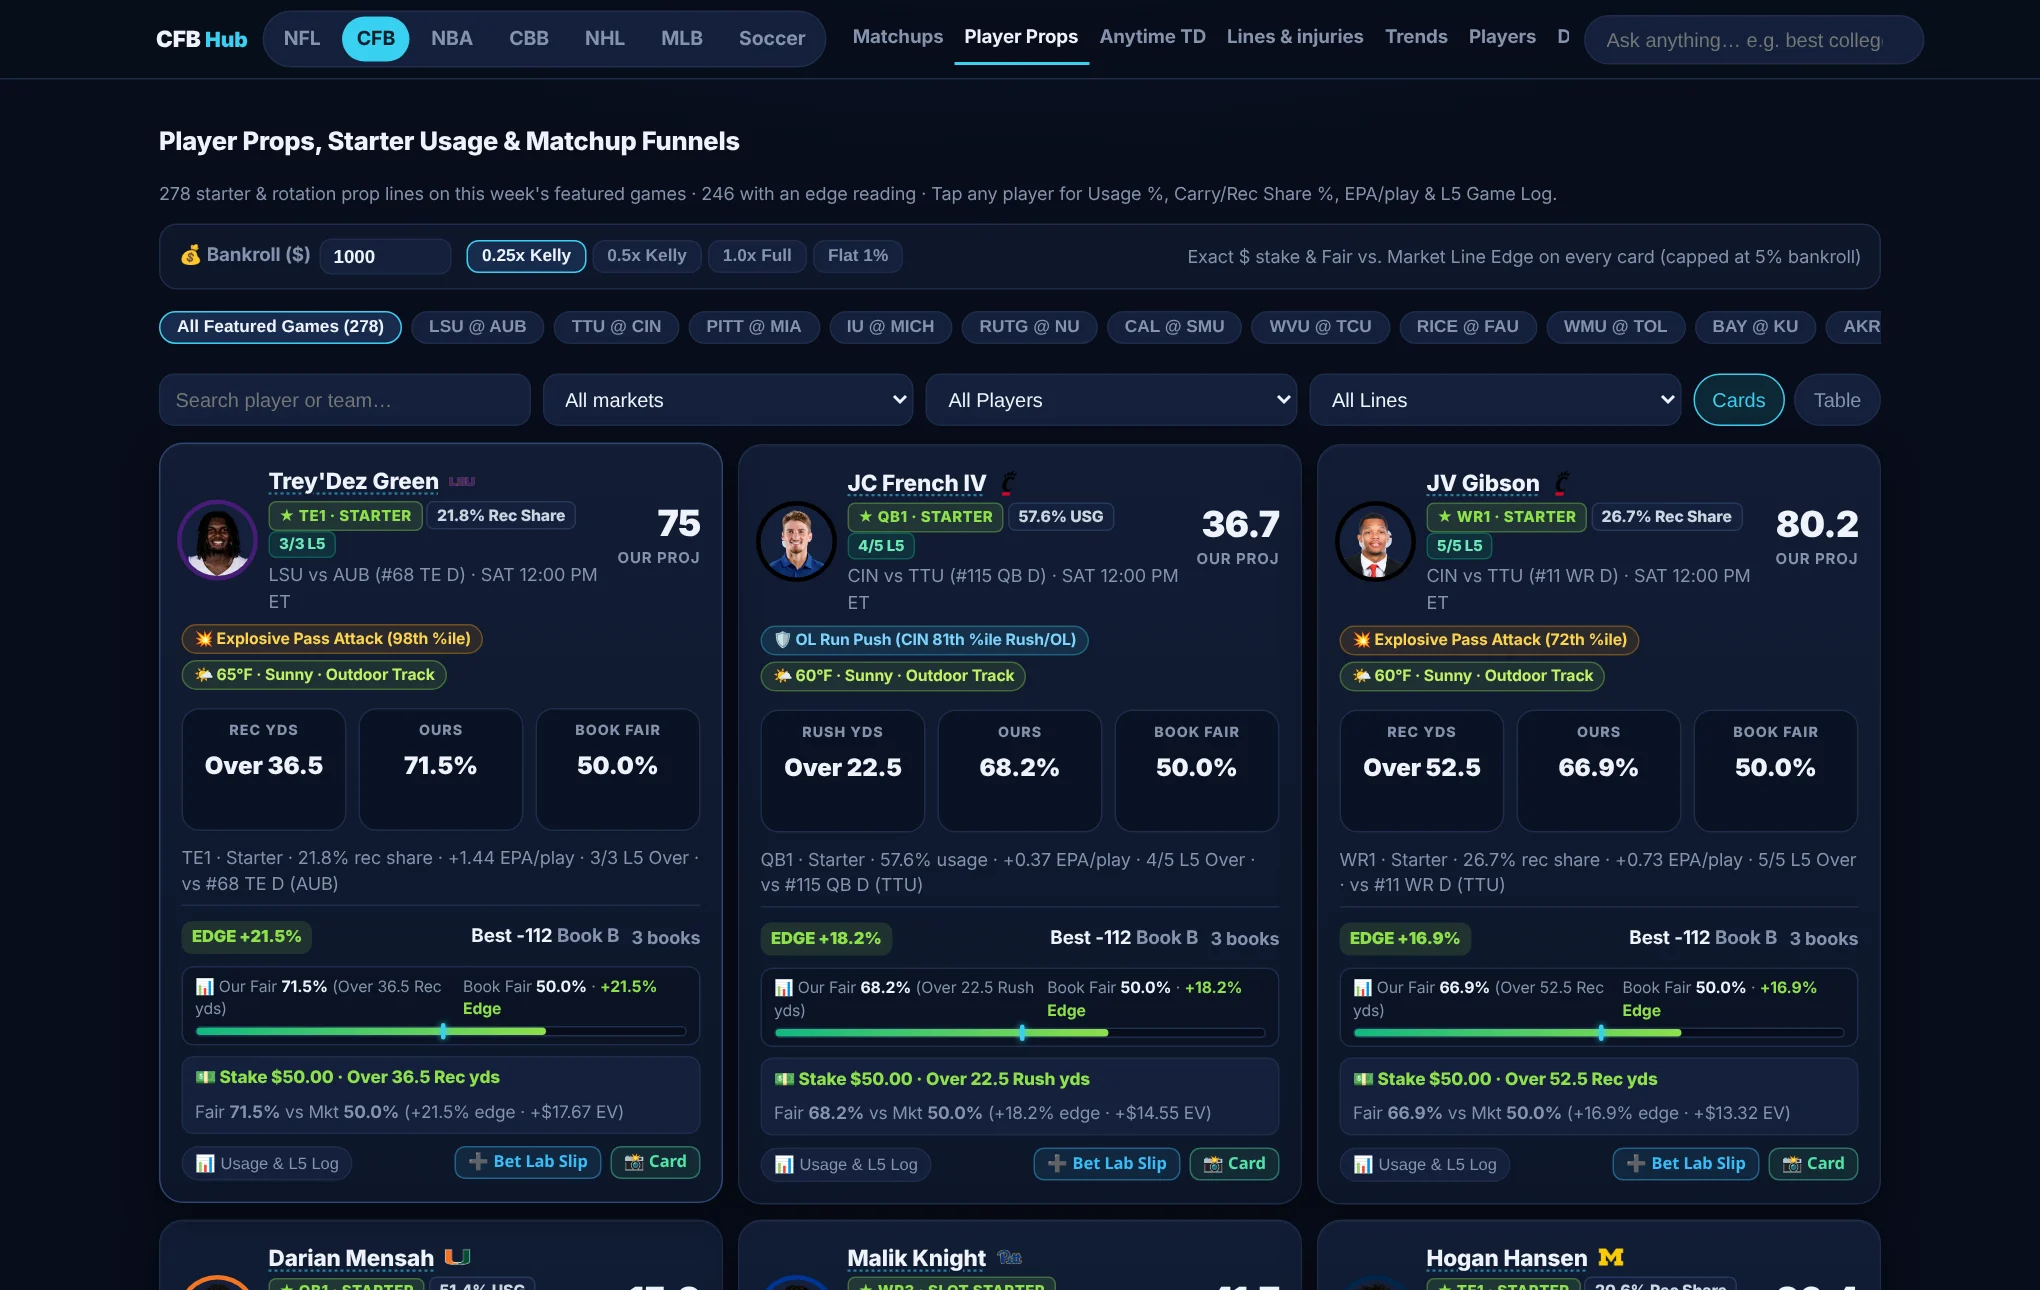
Open NFL Hub →CFB Hub
The full NFL-Hub experience for all 138 FBS teams: verified starter player props with usage, carry & target shares and EPA/play, Player Detail & Prop Intel Drawers, Anytime TD board, Lines & Injuries trench cascades, L5 prop streaks, DVP funnels, O-Line analytics and 10,000-sim Power Rankings.
NBA Hub
All 30 NBA teams: Today's Slate & Pace/Total Matchups, Starting 5 Rotations & Injury Usage Cascades, 30-Team Positional DvP & 5-Zone Court Shot Matrix, Spot vs. Fake-Out Reads, and Correlated SGP Builder.
CBB Hub
All 365 Division I basketball programs with Calculated Upset Alert Radar (36 spotlights), Rolling 10-Game Season Segments (G1–10 → G21–30), 140 Usage Prop Hurdles, Top Freshmen vs. Transfers Tracker, 365-Team Matchup Simulator, full 2026-27 rosters and 2027 NBA Draft Prospects.
Soccer Hub
Multi-competition intelligence across UCL, EPL, La Liga, Serie A, Bundesliga, Ligue 1, MLS & Domestic Cups with a Tournament / Cup / Group-Stage Context Engine (2-leg aggregate & ET/PK math, squad rotation risk), Bivariate Poisson scorelines and Interactive Player & Team Profile Modals.
Open Soccer Hub →SportsLabs HQ
Cross-sport daily briefing, live scoreboard, unified account & Kelly bankroll slip sync, and one-tap navigation across all 16 live Sports Labs apps.
Open SportsLabs HQ →GM Hub
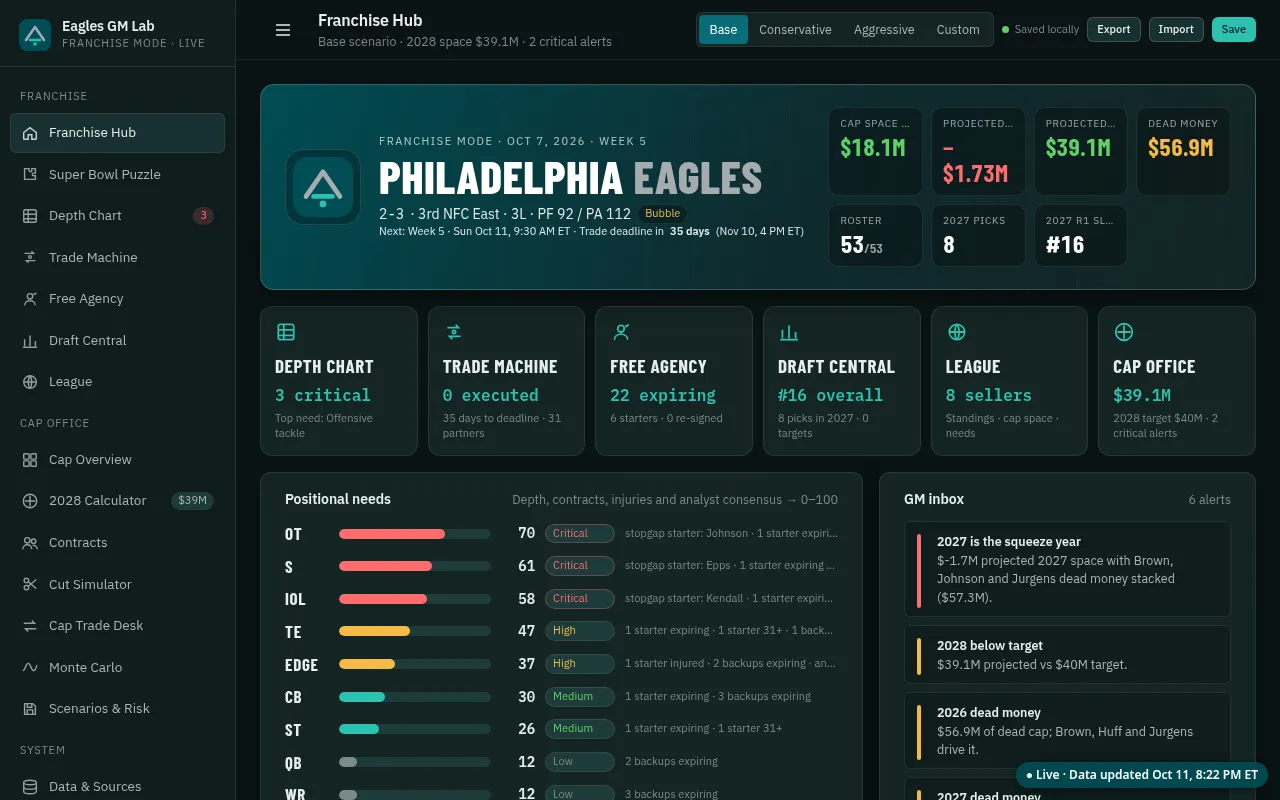
Roster, depth chart, cap center, trade machine, draft board and player value — live hubs for the Eagles, Red Sox, Orioles and Cubs.
Explore GM Hub →Why Sports Labs
Performance, not opinions
Player value comes from position-specific stats, percentile ranks vs league peers and availability-adjusted talent. No subjective video-game ratings.
Transparent by design
Every number labels its source, and estimates are marked as estimates. You can see exactly how a score is built.
Always current
Scheduled pipelines refresh rosters, injuries, contracts and odds. Every app shows when its data was last updated.
The SportsLabs Edge Score BETA
One number from 1 to 99 for how strong a decision looks, paired with a SportsLabs Risk Score from 1 to 99 for how wide the outcomes are. High Edge with low Risk is the sweet spot.
SportsLabs Edge Score (beta) demo, computed from Fantasy Frontier's live DFS slate. Scores run 1–99 from Fantasy Frontier’s live slate (demo only).
The score family
One umbrella, the SportsLabs Edge Score, with a named score for each job. Each one is paired with the SportsLabs Risk Score.
| Product | What Edge Score means | What SportsLabs Risk Score means |
|---|---|---|
| Bet Lab | Model probability vs. the market price on a bet | Hit-rate stability and downside of the outcome |
| Arb Lab | Estimated fee-adjusted value of an arb (prices can move) or promo conversion | Execution risk: depth, price moves, settlement rules |
| Fantasy Frontier | DFS projection plus points per $1K of salary | Lineup variance: cash-game safe vs. tournament swing |
| Fantasy Front Office | Start/sit and trade strength in your league's scoring | Boom-bust spread of weekly outcomes |
| GM Hub | Player and contract value: production vs. peers, relative to cost | Age, injury and performance volatility on the deal |
Inside the products
Real screens from the live apps.
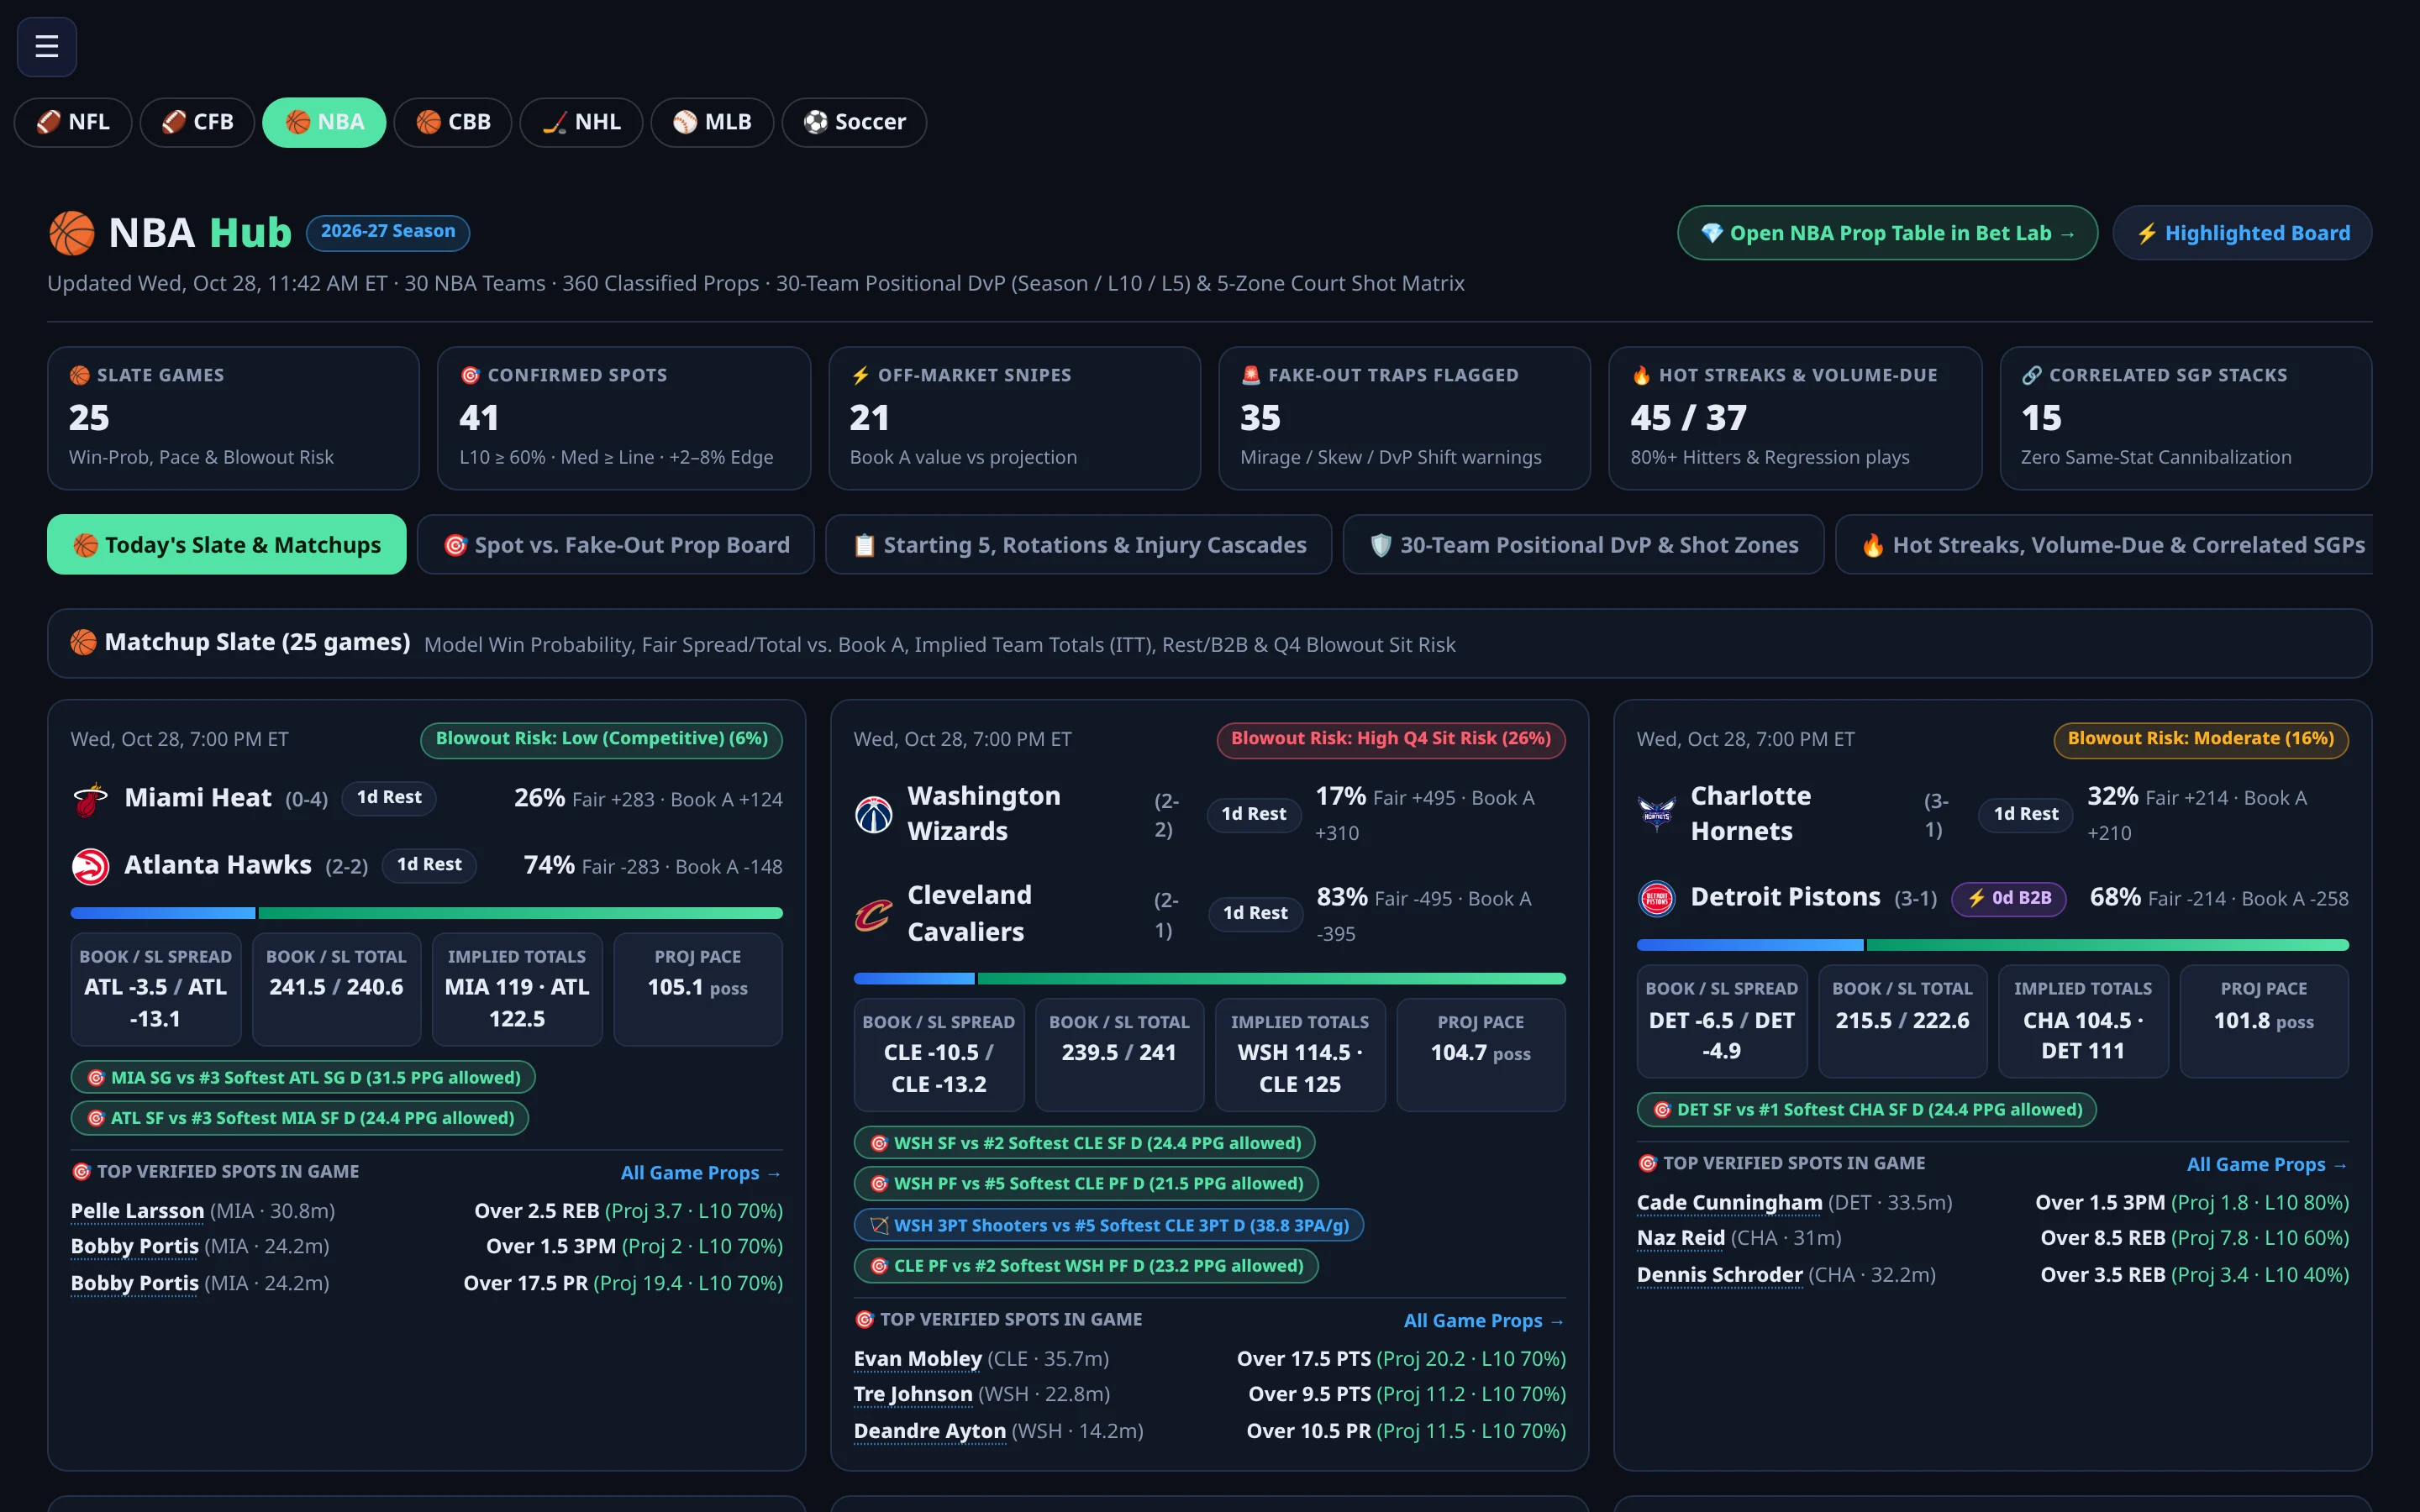
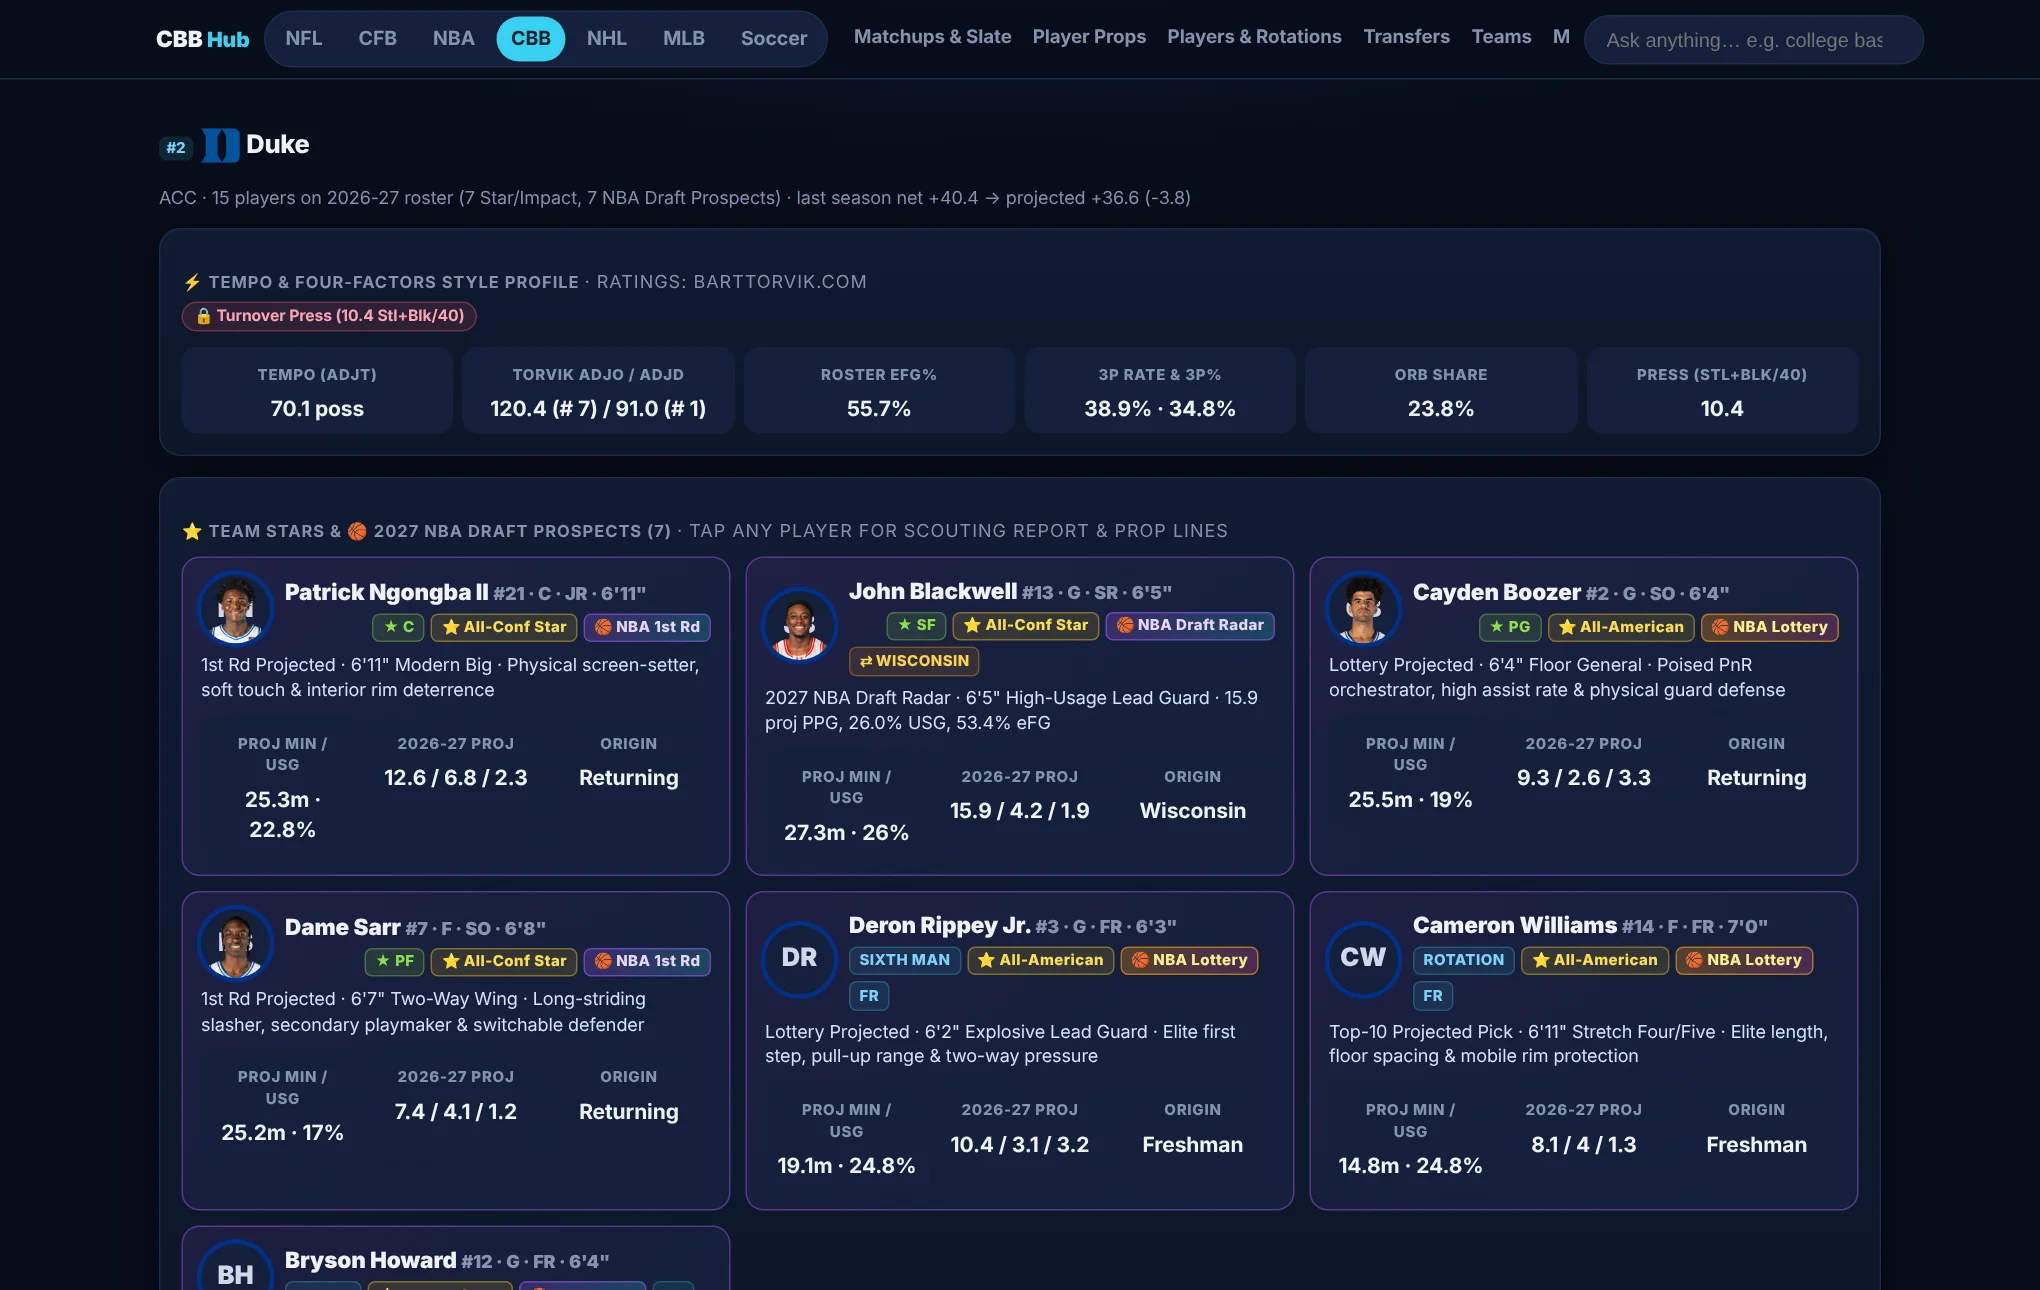
Our tracked record & model calibration
Every model is tested walk-forward using only data available before kickoff or first pitch. No cherry-picking — the calibration curves, bin tables and market comparisons stay on the page.
MLB HR Score · 2026 season
Plate appearances tested with only pre-game data. Brier 0.0994 vs 0.1012 baseline (p < 0.0001). Top 10% hit a home run at 2.07× the league rate (17.6%, matching our 17.5% estimate). Full backtest →
NFL Anytime TD · Weeks 1–7
Starter player-games re-estimated each week using only prior weeks' data. Model Brier 0.1726 (log loss 0.527) beats league base rate (0.1835) and raw player season rate (0.2377). Mean predicted 24.1% vs 24.2% actual.
Honest market benchmark
Where closing market prices exist, we publish the head-to-head comparison: our NFL win-probability model edged closing lines in 2025 (Brier 0.2107 vs 0.2112, n=285) and 2026 (0.2321 vs 0.2345, n=93), while pre-game markets edged our MLB HR model (0.1059 vs 0.1066).
Products & live apps
16 live apps: Bet Lab (7 sports: NFL, CFB, NBA, CBB, NHL, MLB, Soccer), Arb Lab (10 books), NFL Hub, CFB Hub, NBA Hub, CBB Hub, NHL Lab, MLB Lab, Soccer Hub, Fantasy Frontier, Fantasy Front Office, SportsLabs HQ and GM Hub (4 club hubs).
📈 Published Walk-Forward Calibration Proof (Predicted vs. Observed Hit Rate)
Updated Oct 28, 2026 · Out-of-sample predictions only (dashed 45° line = perfect calibration)| Bin | 0–10% | 10–20% | 20–30% | 30–40% | 40–50% | 50–60% | 60–80% |
|---|---|---|---|---|---|---|---|
| Predicted | 6.4% | 15.0% | 24.8% | 34.3% | 44.2% | 54.1% | 66.5% |
| Observed | 10.7% | 17.3% | 24.2% | 32.3% | 37.3% | 46.8% | 72.0% |
| Sample (n) | 169 | 405 | 359 | 186 | 102 | 47 | 25 |
| Decile | D1 | D2 | D3 | D4 | D5 | D6 | D7 | D8 | D9 | D10 | Top 5 |
|---|---|---|---|---|---|---|---|---|---|---|---|
| Predicted | 33.5% | 37.8% | 40.6% | 43.1% | 45.3% | 47.3% | 49.3% | 51.2% | 53.5% | 57.9% | 59.9% |
| Observed | 32.9% | 37.7% | 41.1% | 43.0% | 44.7% | 46.9% | 49.2% | 53.4% | 51.5% | 55.9% | 58.7% |
October 2026 build log · 12 products across 16 live apps shipped Oct 8–28
Every hub and engine runs on automated public-data pipelines, multi-book no-vig pricing, universal Free-Member gating and nightly box-score grading.
Research tools for bettors and fantasy players.
Research DFS slates and value plays, and own your fantasy leagues with Fantasy Front Office — all for only $20/mo.
Sign up free — 7 days of everything, no card. Every lab unlocks the moment you create your account.
If you build it, they will come.
We built it. Research tools for bettors and fantasy players — $20/mo or Annual special $100/yr, with a 7-day free trial.